Fig. 4
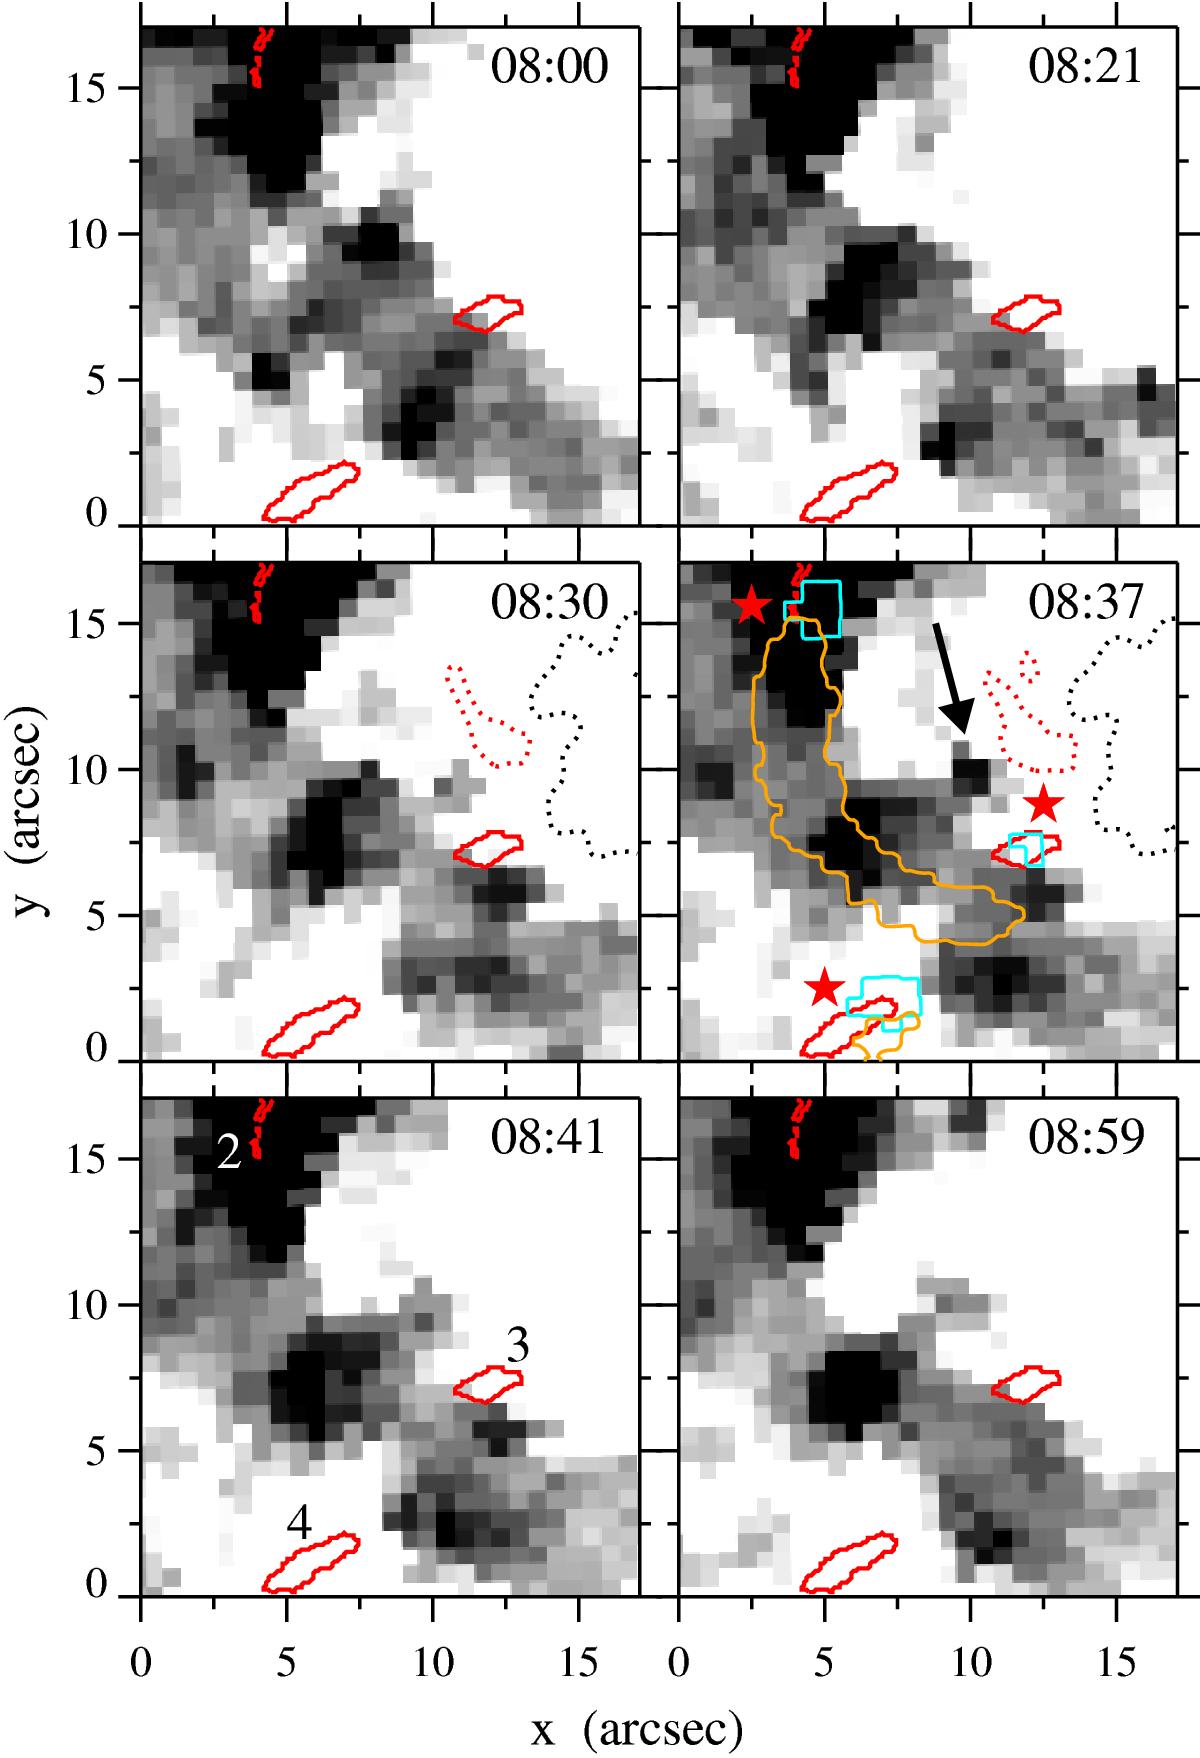
HMI LOS magnetograms clipped between ±40 G at selected times from 08:00 until 09:00 UT. The FOV corresponds to the black rectangle in the magnetogram panel of Fig. 2. The contours show the following: blue represents AIA 1600 Å brightenings, orange marks the flaring arch in AIA 131 Å, red shows the GFPI Ca ii 8542 Å line-core brightenings, and dotted black and red represents the pore and forming penumbra, respectively. All contours refer to their time except the Ca ii brightenings, which are static in all panels. The arrow at 08:37 UT points toward a newly appearing negative polarity. The three red stars next to the red contours indicate the beginning and location of the impulsive phase.
Current usage metrics show cumulative count of Article Views (full-text article views including HTML views, PDF and ePub downloads, according to the available data) and Abstracts Views on Vision4Press platform.
Data correspond to usage on the plateform after 2015. The current usage metrics is available 48-96 hours after online publication and is updated daily on week days.
Initial download of the metrics may take a while.