Fig. 2
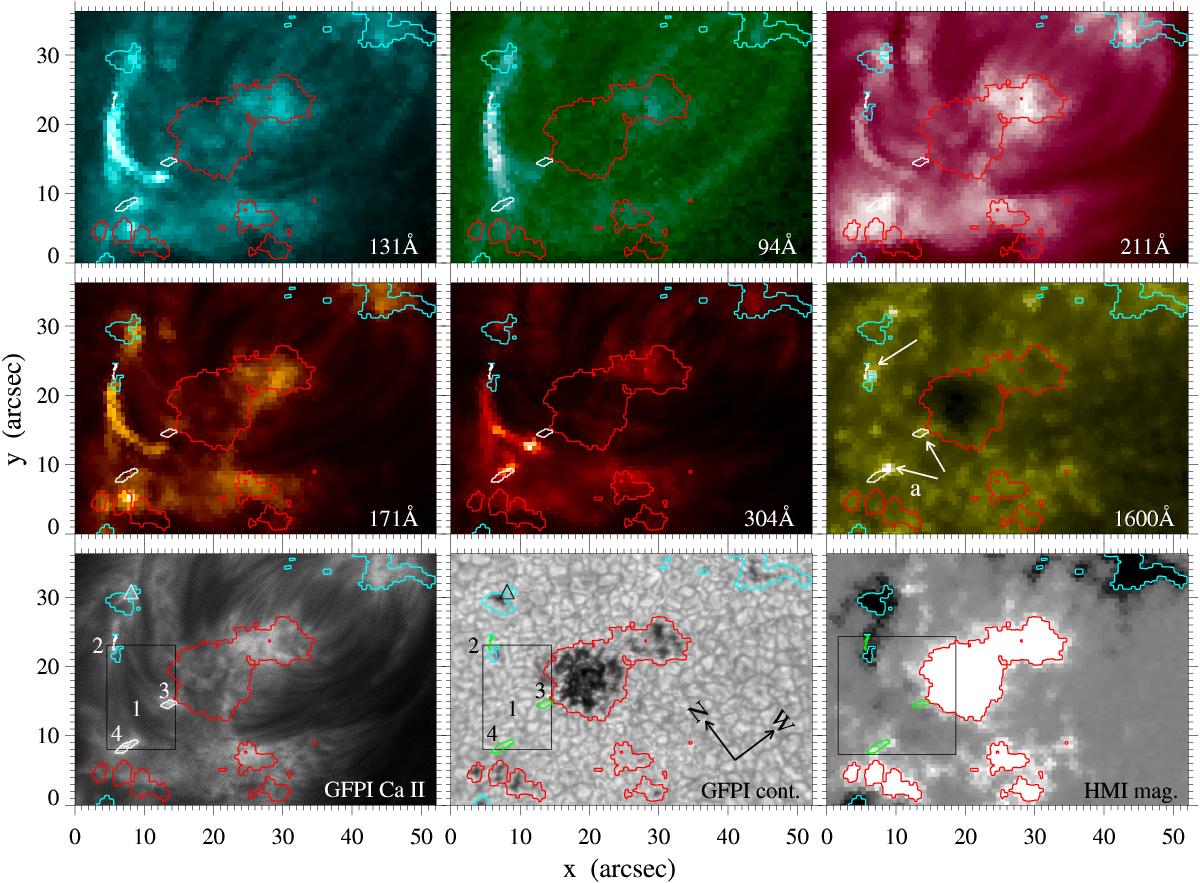
Active region NOAA 12149 observed with SDO and GFPI. SDO images are shown for the time period 08:37:23–08:37:50 UT. The GFPI filtergrams correspond to 08:38:13 UT. Blue and red contours mark the negative and positive polarities, respectively, obtained from the HMI magnetogram saturated to ± 350 G in the lower right panel. The white contours (green in the case of the two bottom rightmost images), which are enumerated with numbers 2–4, correspond to the brightenings in the GFPI Ca ii line-core image between 08:37–08:39 UT. Number 1 marks an area of dark filamentary structure as seen in the Ca ii line-core image. Solar north and west are indicated by the arrows in the GFPI continuum panel at the bottom. The box in the HMI panel shows the FOV of the magnetograms in Fig. 4. The rectangle in the GFPI panels outlines the FOV of the inversions shown in Figs. 5 and 6. The triangle in the upper left corner of the GFPI panels highlights a persistent enhancement of the Ca ii line core. The arrows in the AIA 1600 Å panel indicate three areas with sudden brightenings. The temporal evolution of this figure is shown between 08:35:08 and 08:39:08 in an online movie.
Current usage metrics show cumulative count of Article Views (full-text article views including HTML views, PDF and ePub downloads, according to the available data) and Abstracts Views on Vision4Press platform.
Data correspond to usage on the plateform after 2015. The current usage metrics is available 48-96 hours after online publication and is updated daily on week days.
Initial download of the metrics may take a while.