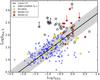
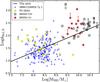
Fig. 8

Bolometric correction in the 2–10 keV band as a function of the Eddington ratio λEDD (left panel) and as a function of the black hole mass (right panel). The open stars represent WISSH quasars with CIV-based SMBH masses (Weedman et al. 2012); red filled stars represent Hβ-based SMBH masses (Bischetti et al. 2017, Vietri et al., in prep.). The blue empty triangles indicate the broad-line AGN sample from the XMM-Newton-COSMOS survey by Lusso et al. (2012). The yellow squares indicate PG quasars. The black solid line in the left panel represents the relation found by Lusso et al. 2012 for Type 1 AGN, while the gray shaded area indicates the 1σ dispersion on the relation. The black solid line in the right panel indicates the linear fit found in this work. As in Fig. 6, we report two values for the hard X-ray luminosity of J0045+1438, connected by a gray line. We calculated the L2−10 with the best-fit value of NH (i.e., 4 × 1022 cm-2, black open star) and the upper error (i.e., NH = 1.5 × 1023 cm-2, gray open star), respectively.
Current usage metrics show cumulative count of Article Views (full-text article views including HTML views, PDF and ePub downloads, according to the available data) and Abstracts Views on Vision4Press platform.
Data correspond to usage on the plateform after 2015. The current usage metrics is available 48-96 hours after online publication and is updated daily on week days.
Initial download of the metrics may take a while.