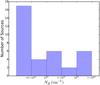
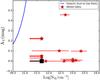
Fig. 2

Left panel: distribution of absorption column densities for the 35 X-ray detected quasars, derived by HR or spectral analysis. Right panel: AV magnitudes vs. X-ray absorption column densities derived by spectral analysis. The black square represents values of NH= 5 × 1021 cm-2 and AV = 0 for 8 sources (see Table 2). The blue solid line represents the relation obtained by assuming a Galactic dust-to-gas ratio, i.e., AV = 10(log NH−21.278) mag (Maiolino et al. 2001).
Current usage metrics show cumulative count of Article Views (full-text article views including HTML views, PDF and ePub downloads, according to the available data) and Abstracts Views on Vision4Press platform.
Data correspond to usage on the plateform after 2015. The current usage metrics is available 48-96 hours after online publication and is updated daily on week days.
Initial download of the metrics may take a while.