Fig. 8
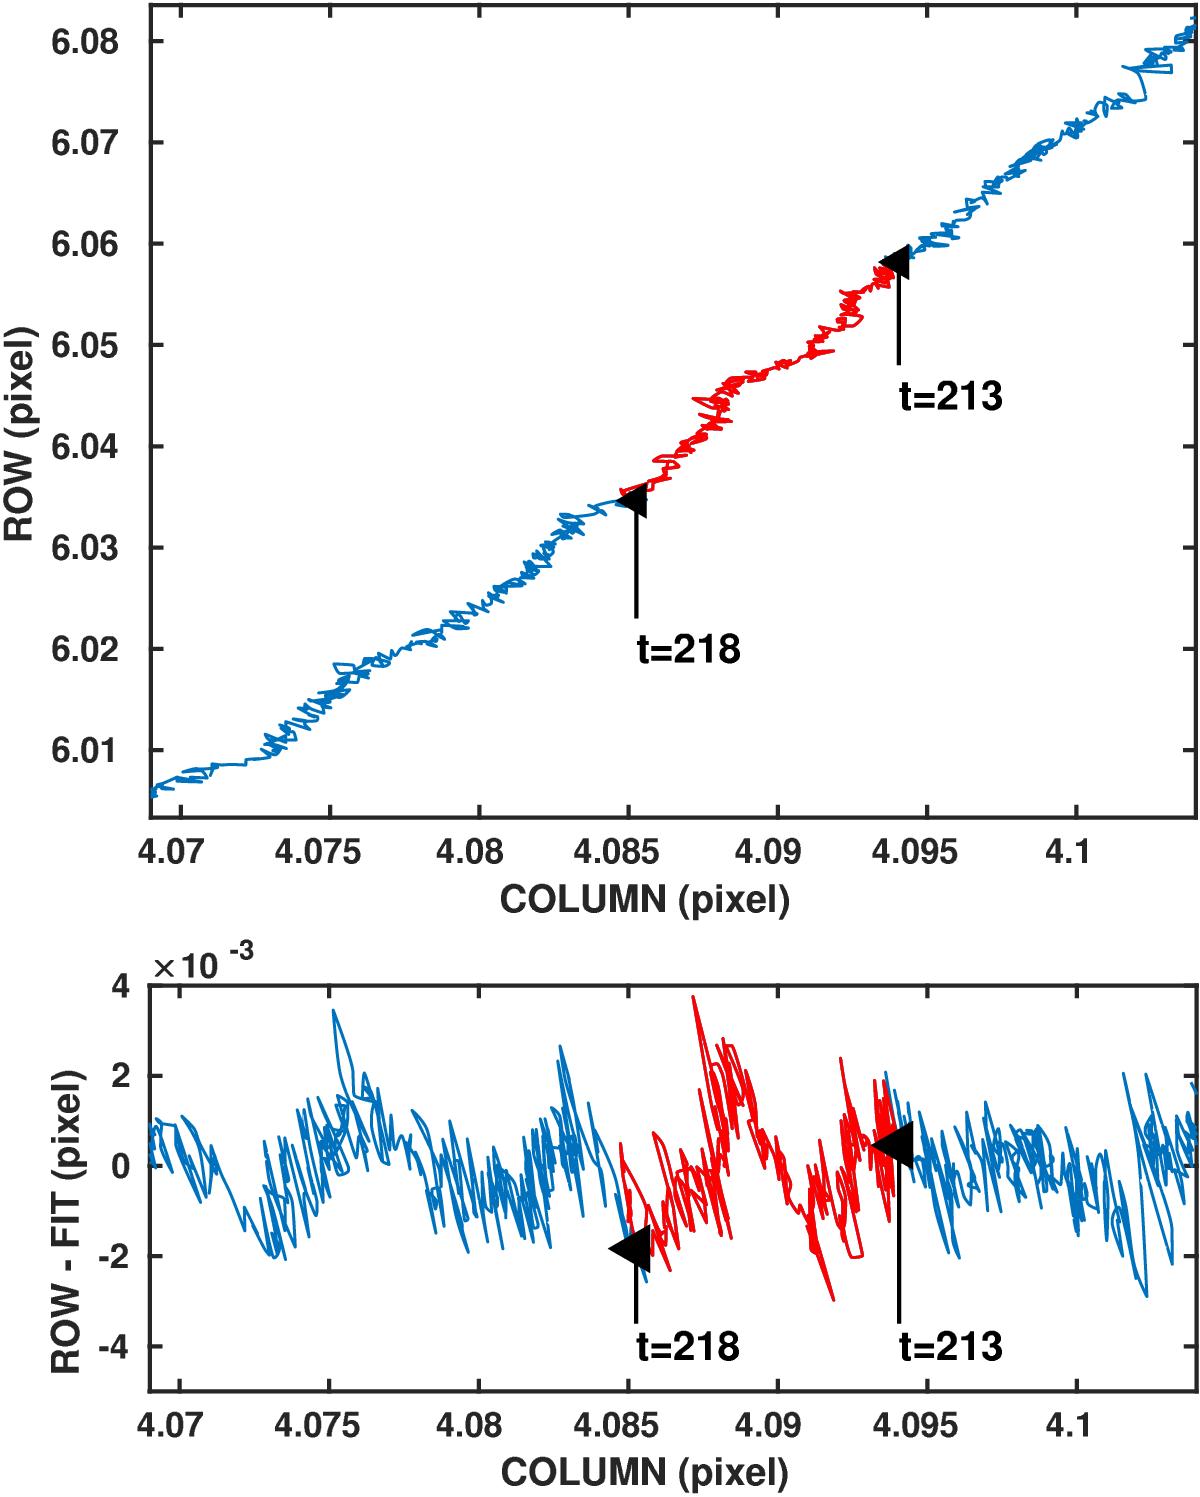
Top panel: position of the PSF centroid around event A, from epochs 208 to 225 (in blue), and highlighted in red, from ingress (213) to egress (220). Time arrow goes from top right to bottom left. Bottom panel: PSF centroid motion around the 4th degree polynomial fit of the main trend in the top panel. The modulation period is about 3 days.
Current usage metrics show cumulative count of Article Views (full-text article views including HTML views, PDF and ePub downloads, according to the available data) and Abstracts Views on Vision4Press platform.
Data correspond to usage on the plateform after 2015. The current usage metrics is available 48-96 hours after online publication and is updated daily on week days.
Initial download of the metrics may take a while.