Fig. 1
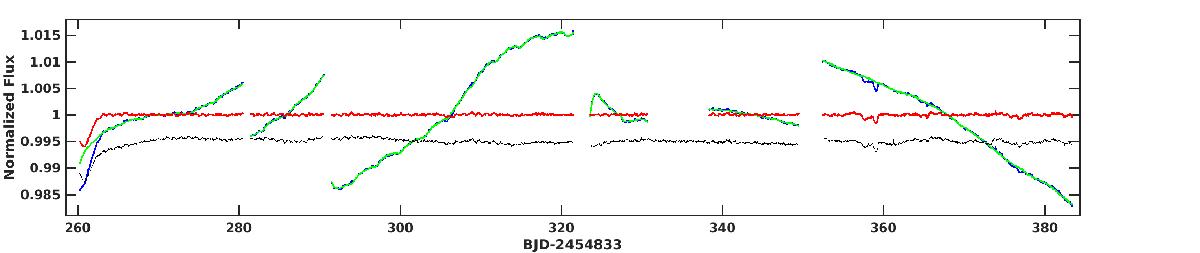
Example of CBVs fit on light curves with small or no dips. The raw SAP light curve is indicated in blue, the fitted CBVs are indicated in green, and the final detrended SAP light curve is indicated in red. For comparison, we superimposed in black the PDCSAP data with an offset of −0.005 for visual convenience. The green and blue curves overlap most of the time, but it can be seen on some shallow dips (e.g. at BJD-2 454 833 = 360) that the fitted CBVs, shown in green, stay at the baseline level during these events.
Current usage metrics show cumulative count of Article Views (full-text article views including HTML views, PDF and ePub downloads, according to the available data) and Abstracts Views on Vision4Press platform.
Data correspond to usage on the plateform after 2015. The current usage metrics is available 48-96 hours after online publication and is updated daily on week days.
Initial download of the metrics may take a while.