Fig. 9
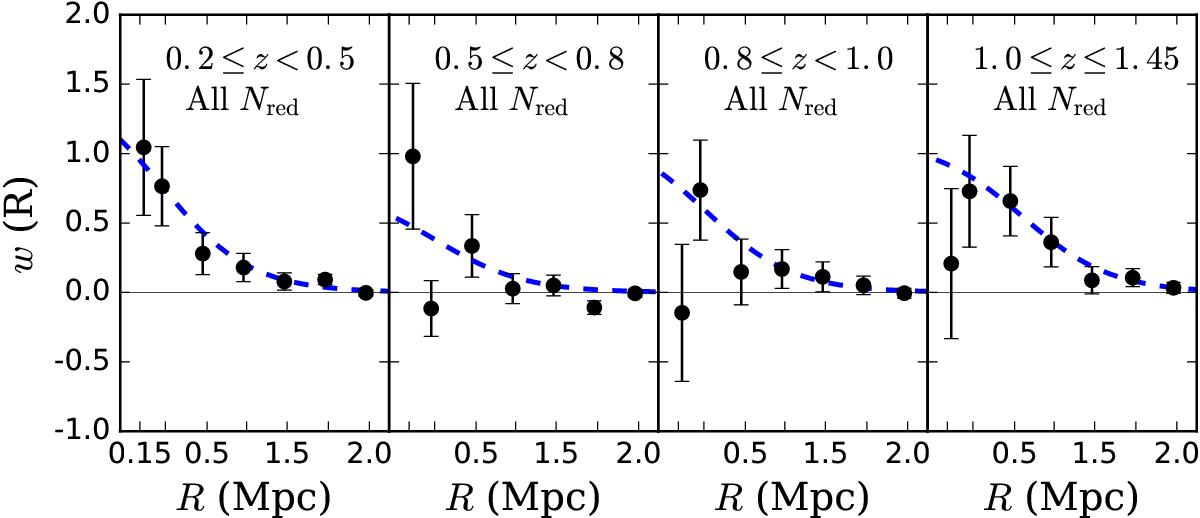
Angular cross-correlation measurements between the u-dropouts and the centres of galaxy clusters, as a function of the radial distance from the cluster centres in physical units. The sample of galaxy clusters on which the measurement was performed is binned in redshift as shown in each of the figure legends. Best-fit models are plotted with the dotted blue line, while our measurements are represented by the black round points.
Current usage metrics show cumulative count of Article Views (full-text article views including HTML views, PDF and ePub downloads, according to the available data) and Abstracts Views on Vision4Press platform.
Data correspond to usage on the plateform after 2015. The current usage metrics is available 48-96 hours after online publication and is updated daily on week days.
Initial download of the metrics may take a while.