Free Access
Fig. 3
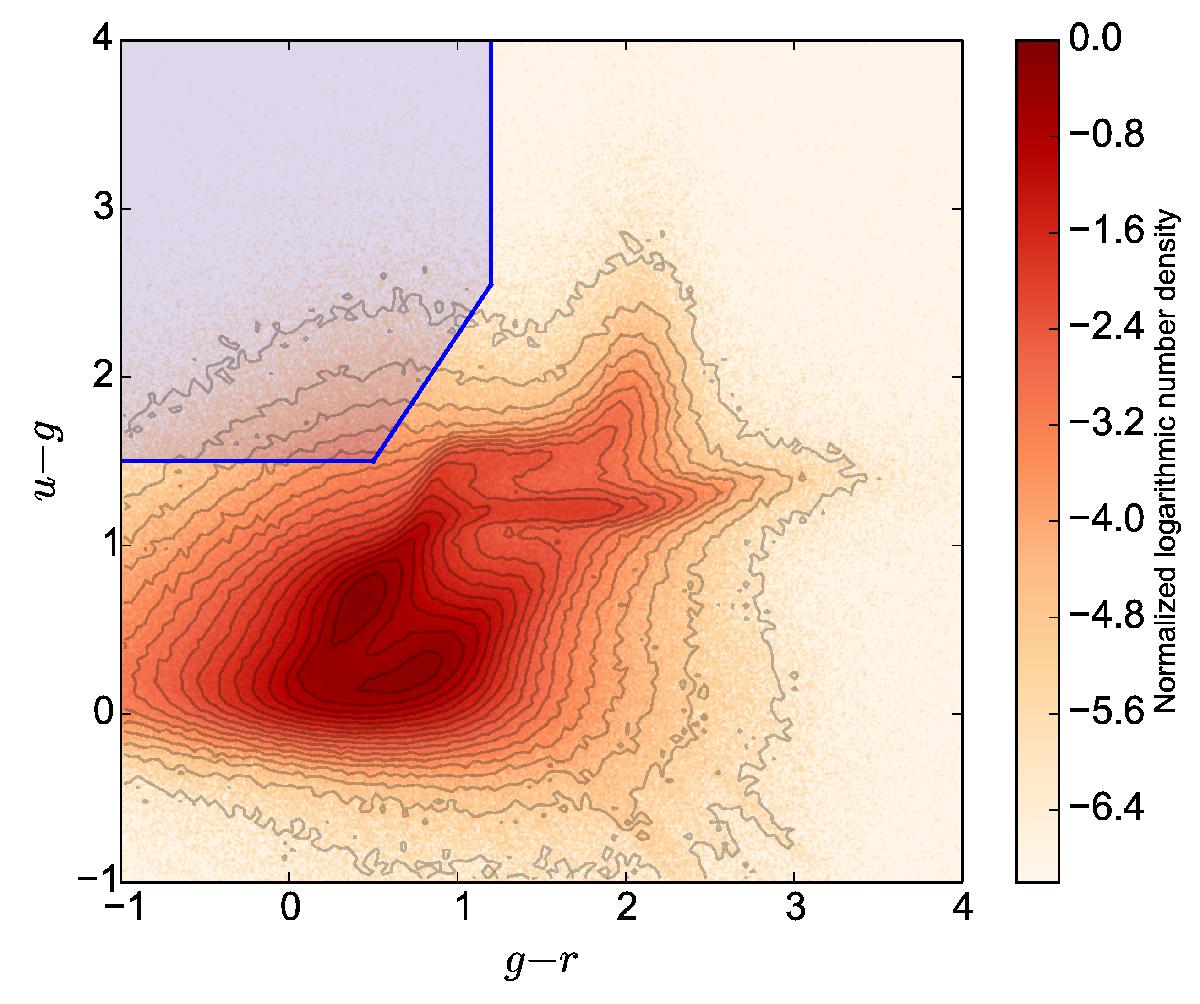
u−g vs. g−r colour–colour number density plot of the galaxies in the SpARCS fields, selected with the SExtractor parameter CLASS_STAR < 0.9. The colour selection criteria described in Sect. 3.2 are delineated on the upper left of the image with the shaded area and the blue lines.
Current usage metrics show cumulative count of Article Views (full-text article views including HTML views, PDF and ePub downloads, according to the available data) and Abstracts Views on Vision4Press platform.
Data correspond to usage on the plateform after 2015. The current usage metrics is available 48-96 hours after online publication and is updated daily on week days.
Initial download of the metrics may take a while.