Fig. 14
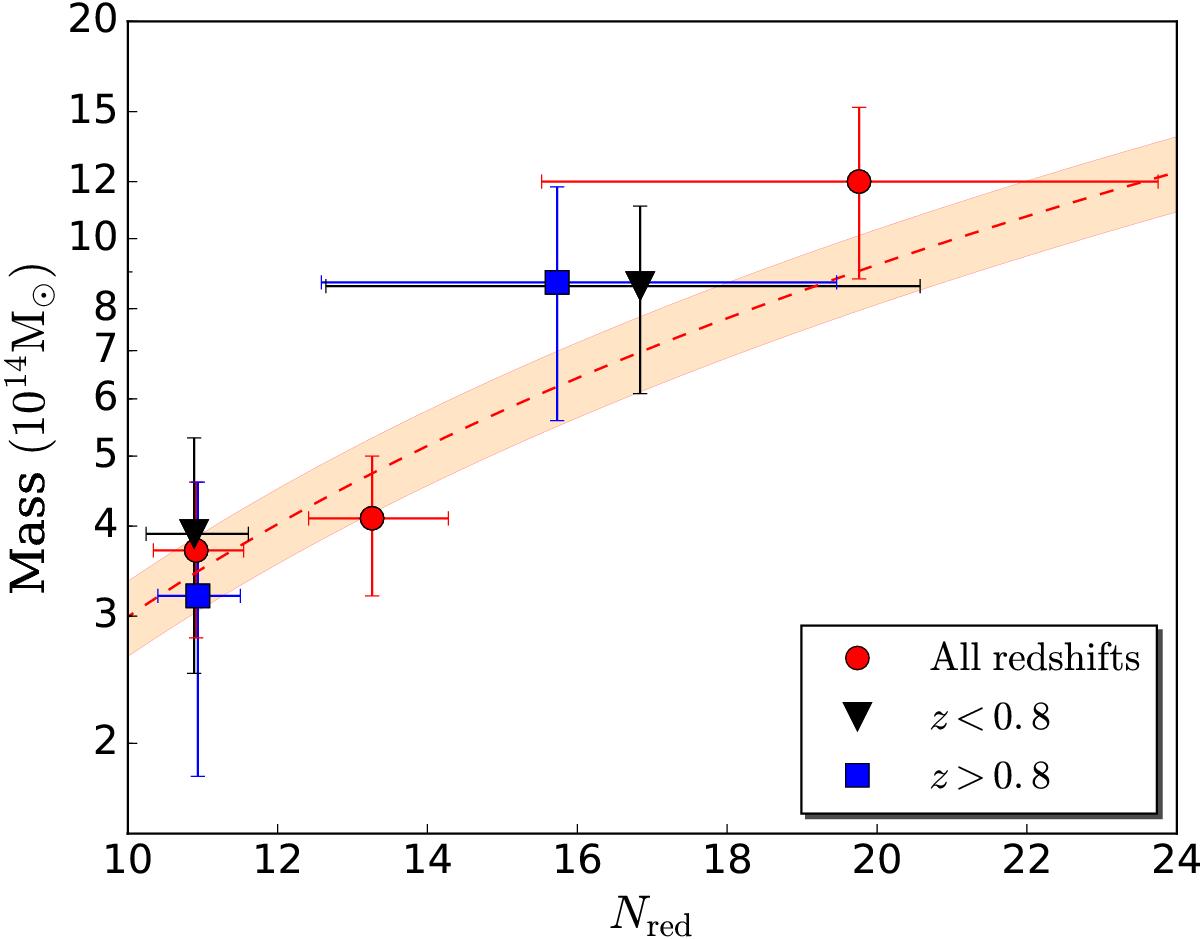
Mass–richness relation for the SpARCS cluster samples as a function of redshift. The dotted line and shaded region represent the best-fit mass–richness relation amplitude for all z, while the associated fit uncertainty is shown by the shaded region. The errorbars on the x-axis represent the ranges in Nred delimited by the 16th and 84th percentile for each sample.
Current usage metrics show cumulative count of Article Views (full-text article views including HTML views, PDF and ePub downloads, according to the available data) and Abstracts Views on Vision4Press platform.
Data correspond to usage on the plateform after 2015. The current usage metrics is available 48-96 hours after online publication and is updated daily on week days.
Initial download of the metrics may take a while.