Fig. 13
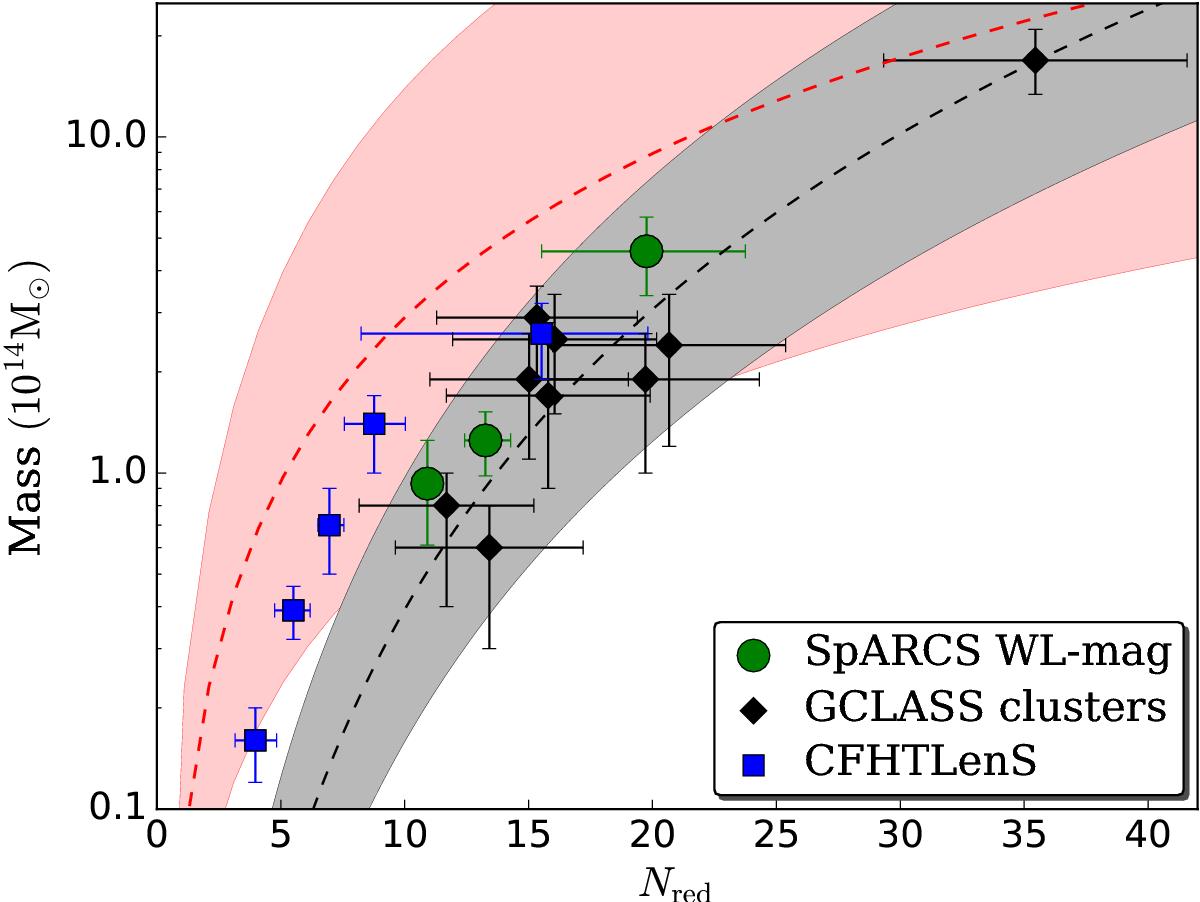
Mass and richness for the SpARCS cluster samples (green filled circles) compared to the CFHTLenS analysis results (Ford et al. 2014), where the corresponding values are transformed into the Nred parameter as described in the text (blue filled squares). The errors of the CFHTLenS data points have the fit uncertainty from Fig. 12 propagated as well. The red dashed line shows the mass–richness relation from Eq. (23), with its uncertainty represented by the red shaded region, while the GCLASS-based mass–richness relation (Eq. (22)) is shown by the black dashed line and respectively the shaded grey area.
Current usage metrics show cumulative count of Article Views (full-text article views including HTML views, PDF and ePub downloads, according to the available data) and Abstracts Views on Vision4Press platform.
Data correspond to usage on the plateform after 2015. The current usage metrics is available 48-96 hours after online publication and is updated daily on week days.
Initial download of the metrics may take a while.