Free Access
Fig. 12
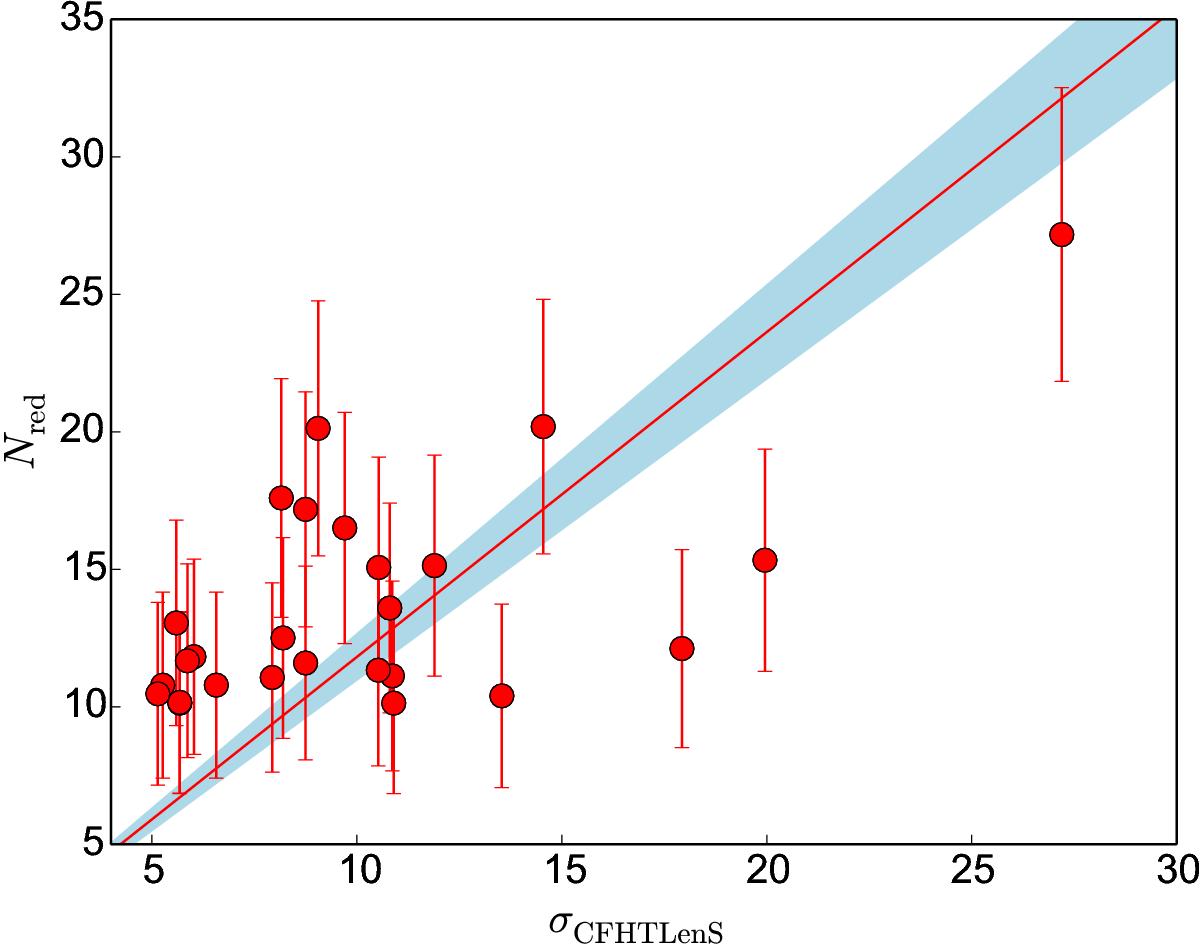
Richness proxies for the galaxy cluster candidates common to CFHTLenS and SpARCS. The best fit linear relation of the form y = ax between the two quantities is shown by the continuous red line, while the associated fitting 1σ uncertainties are shown by the shaded region.
Current usage metrics show cumulative count of Article Views (full-text article views including HTML views, PDF and ePub downloads, according to the available data) and Abstracts Views on Vision4Press platform.
Data correspond to usage on the plateform after 2015. The current usage metrics is available 48-96 hours after online publication and is updated daily on week days.
Initial download of the metrics may take a while.