Fig. 1
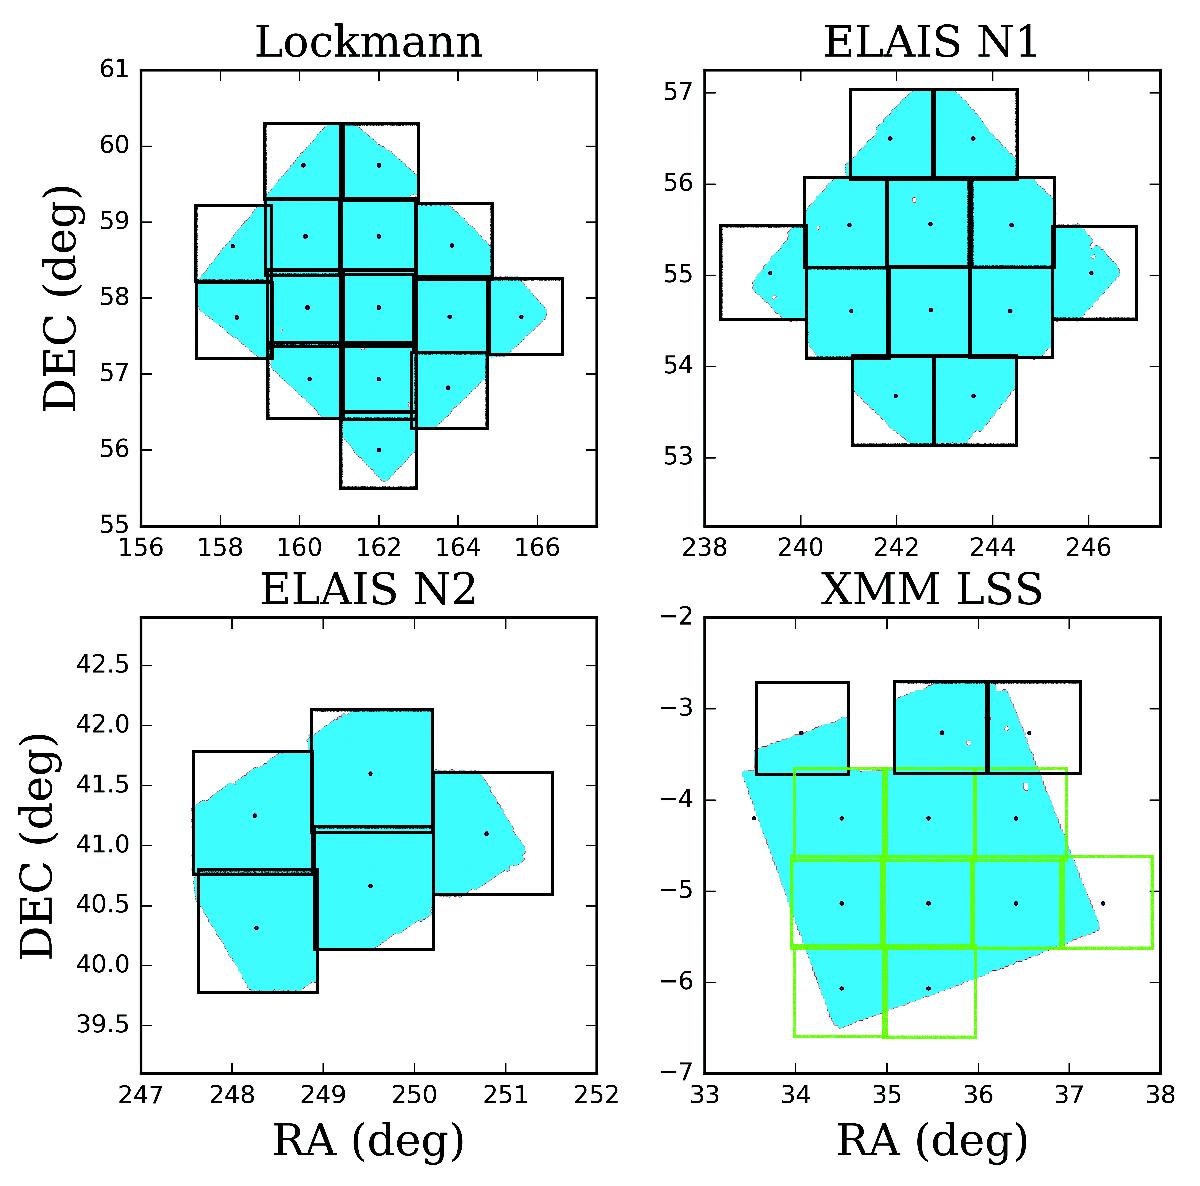
Outline of the SpARCS fields observable from the northern hemisphere. The blue area traces the distribution of sources detected in SWIRE (with the original data masking applied), while the black squares show the locations of the CFHT individual pointings, each covering approximately 1 deg2. The bottom green squares in the XMM LSS field outline the CFHTLS pointings we use. Pointing centres are marked with black dots.
Current usage metrics show cumulative count of Article Views (full-text article views including HTML views, PDF and ePub downloads, according to the available data) and Abstracts Views on Vision4Press platform.
Data correspond to usage on the plateform after 2015. The current usage metrics is available 48-96 hours after online publication and is updated daily on week days.
Initial download of the metrics may take a while.