Free Access
Fig. 4
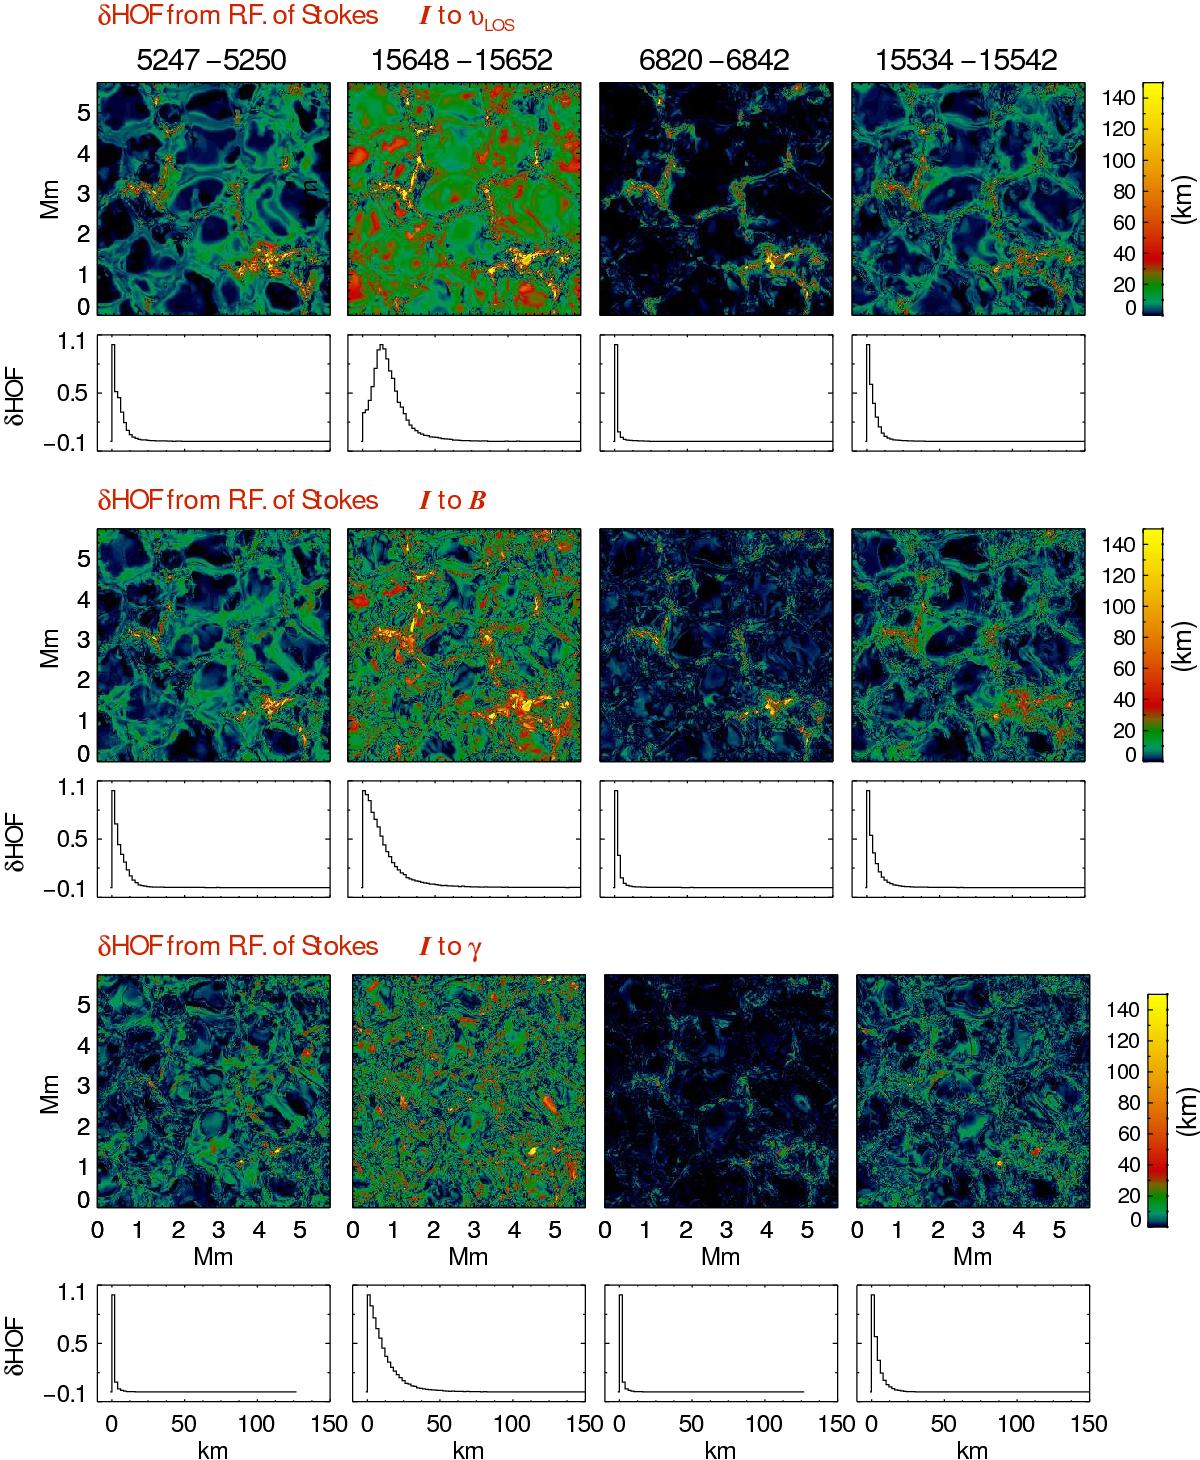
Maps of difference in heights of formation and their histograms. The maps are constructed similar to the third and fifth rows of Fig. 3, but computed from the RFs of Stokes I profiles to perturbations in velocity, magnetic field strength, and inclination.
Current usage metrics show cumulative count of Article Views (full-text article views including HTML views, PDF and ePub downloads, according to the available data) and Abstracts Views on Vision4Press platform.
Data correspond to usage on the plateform after 2015. The current usage metrics is available 48-96 hours after online publication and is updated daily on week days.
Initial download of the metrics may take a while.