Fig. 3
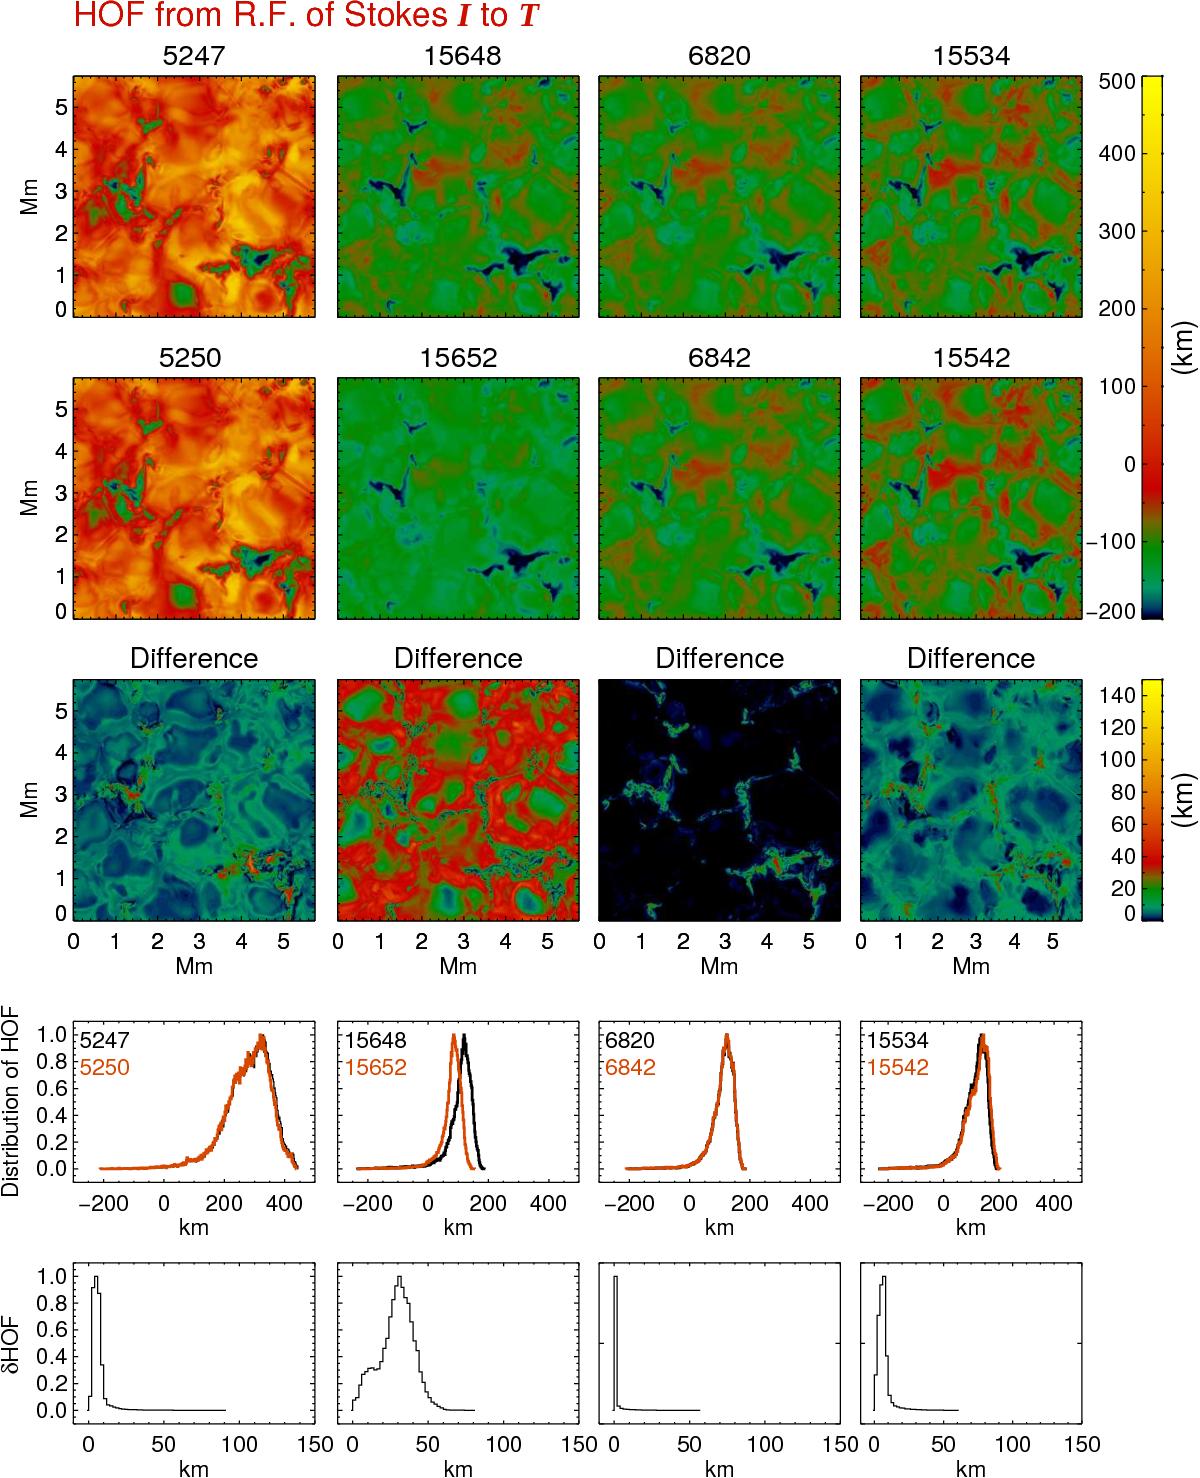
Maps of height of formation (HOF) for different line pairs deduced from the centroid of the response function (RF) of Stokes I profiles to temperature, at the central wavelength. First and second rows: distribution of HOF referring to individual spatial pixels of the MHD cubes is shown. Third row: difference (absolute) in the HOF is shown. Fourth row: histogram of the HOF of the two lines in each pair is shown. Fifth row: histogram of the absolute differences in the HOF is shown.
Current usage metrics show cumulative count of Article Views (full-text article views including HTML views, PDF and ePub downloads, according to the available data) and Abstracts Views on Vision4Press platform.
Data correspond to usage on the plateform after 2015. The current usage metrics is available 48-96 hours after online publication and is updated daily on week days.
Initial download of the metrics may take a while.