Fig. A.1
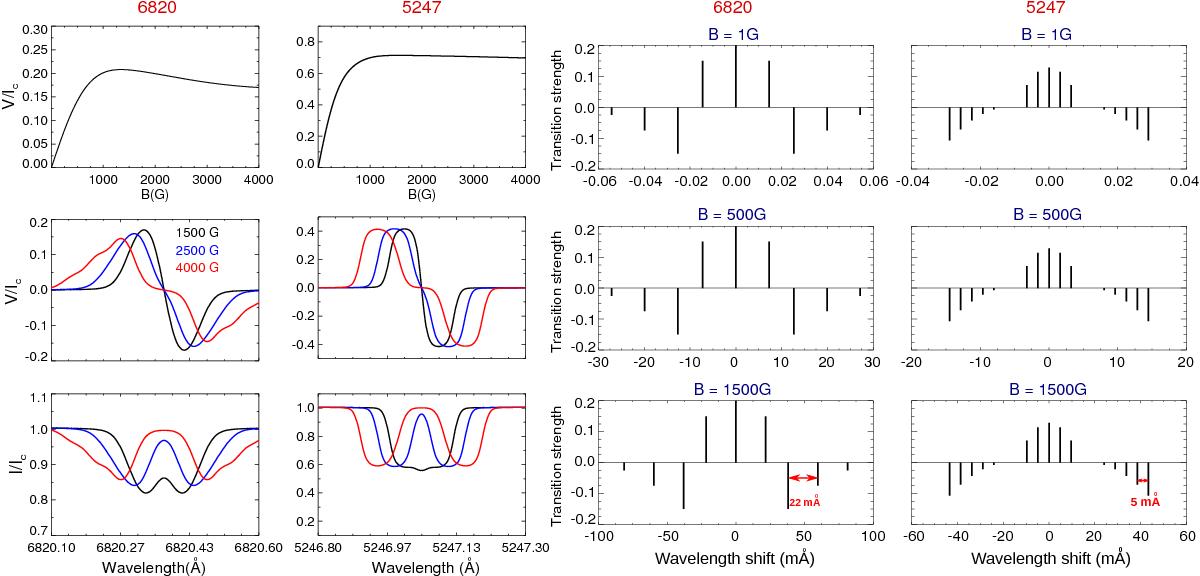
Variation in Stokes V amplitude for the 6820 Å and 5247 Å lines as a function of magnetic field strength (B). Full line profiles are shown for 1.5, 2.5, and 4 kG. A comparison between the Zeeman splitting pattern for the two lines for B = 1, 500 and 1500 G is shown in the last two columns. There is a change in the wavelength scale of these plots with B.
Current usage metrics show cumulative count of Article Views (full-text article views including HTML views, PDF and ePub downloads, according to the available data) and Abstracts Views on Vision4Press platform.
Data correspond to usage on the plateform after 2015. The current usage metrics is available 48-96 hours after online publication and is updated daily on week days.
Initial download of the metrics may take a while.