Fig. 9
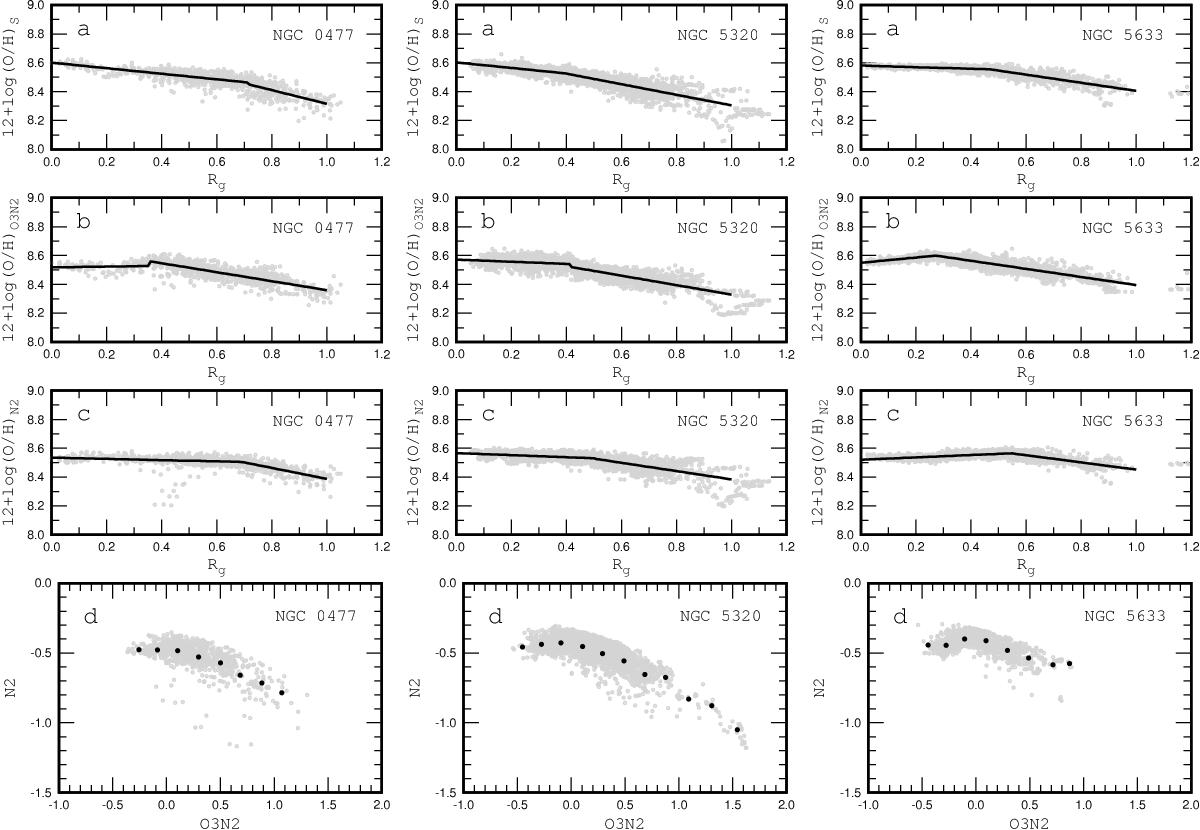
Breaks in the radial distributions of oxygen abundances in discs of three galaxies determined via three different calibrations are depicted. The left column panels show the galaxy NGC 0477, where the break radii in the (O/H)PG16 and the (O/H)M13,N2 distributions are close to each other and differ from the break radius obtained from the (O/H)M13,O3N2 distribution. The grey points in panelsa–c are the data for individual spaxels. The line is the broken linear fit O/H – Rg to those data points. Paneld shows the N2 abundance index as a function of the O3N2 index for individual spaxels (grey points) and mean values for bin sizes of 0.2 in O3N2 (dark points). The middle column panels show the galaxy NGC 5320, where the break radii in the (O/H)PG16 and the (O/H)M13,O3N2 distributions are close to each other and differ from that in the (O/H)M13,N2 distribution. The right column panels show the galaxy NGC 5633, where the break radii for the three abundance determination methods are different.
Current usage metrics show cumulative count of Article Views (full-text article views including HTML views, PDF and ePub downloads, according to the available data) and Abstracts Views on Vision4Press platform.
Data correspond to usage on the plateform after 2015. The current usage metrics is available 48-96 hours after online publication and is updated daily on week days.
Initial download of the metrics may take a while.