Free Access
Fig. 8
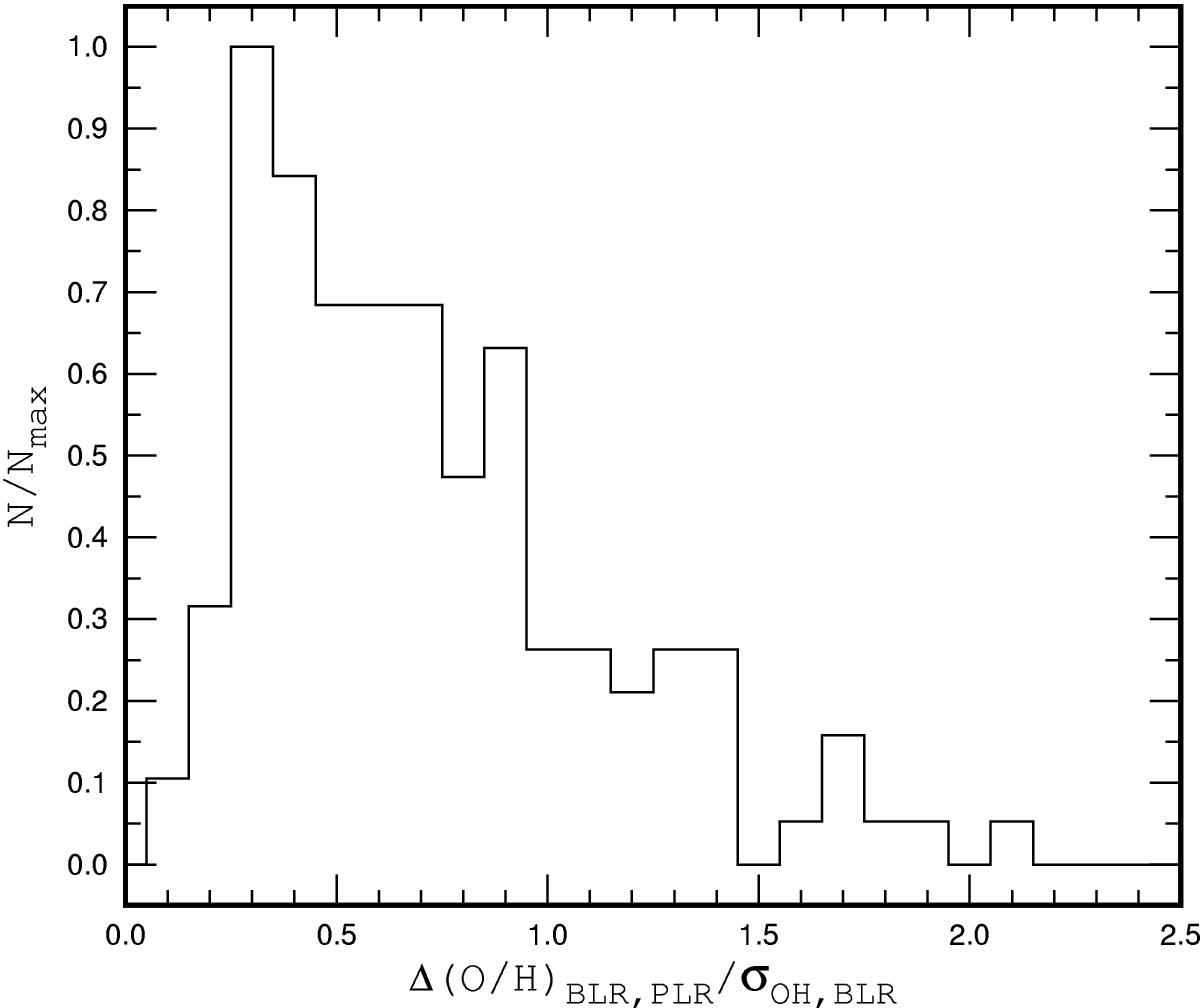
Normalized histogram of the ratios of the difference between broken and linear relation O/H – Rg to the abundance scatter around the broken relation Δ(O/H)BLR,PLR/σOH,BLR for our sample of galaxies.
Current usage metrics show cumulative count of Article Views (full-text article views including HTML views, PDF and ePub downloads, according to the available data) and Abstracts Views on Vision4Press platform.
Data correspond to usage on the plateform after 2015. The current usage metrics is available 48-96 hours after online publication and is updated daily on week days.
Initial download of the metrics may take a while.