Fig. 4
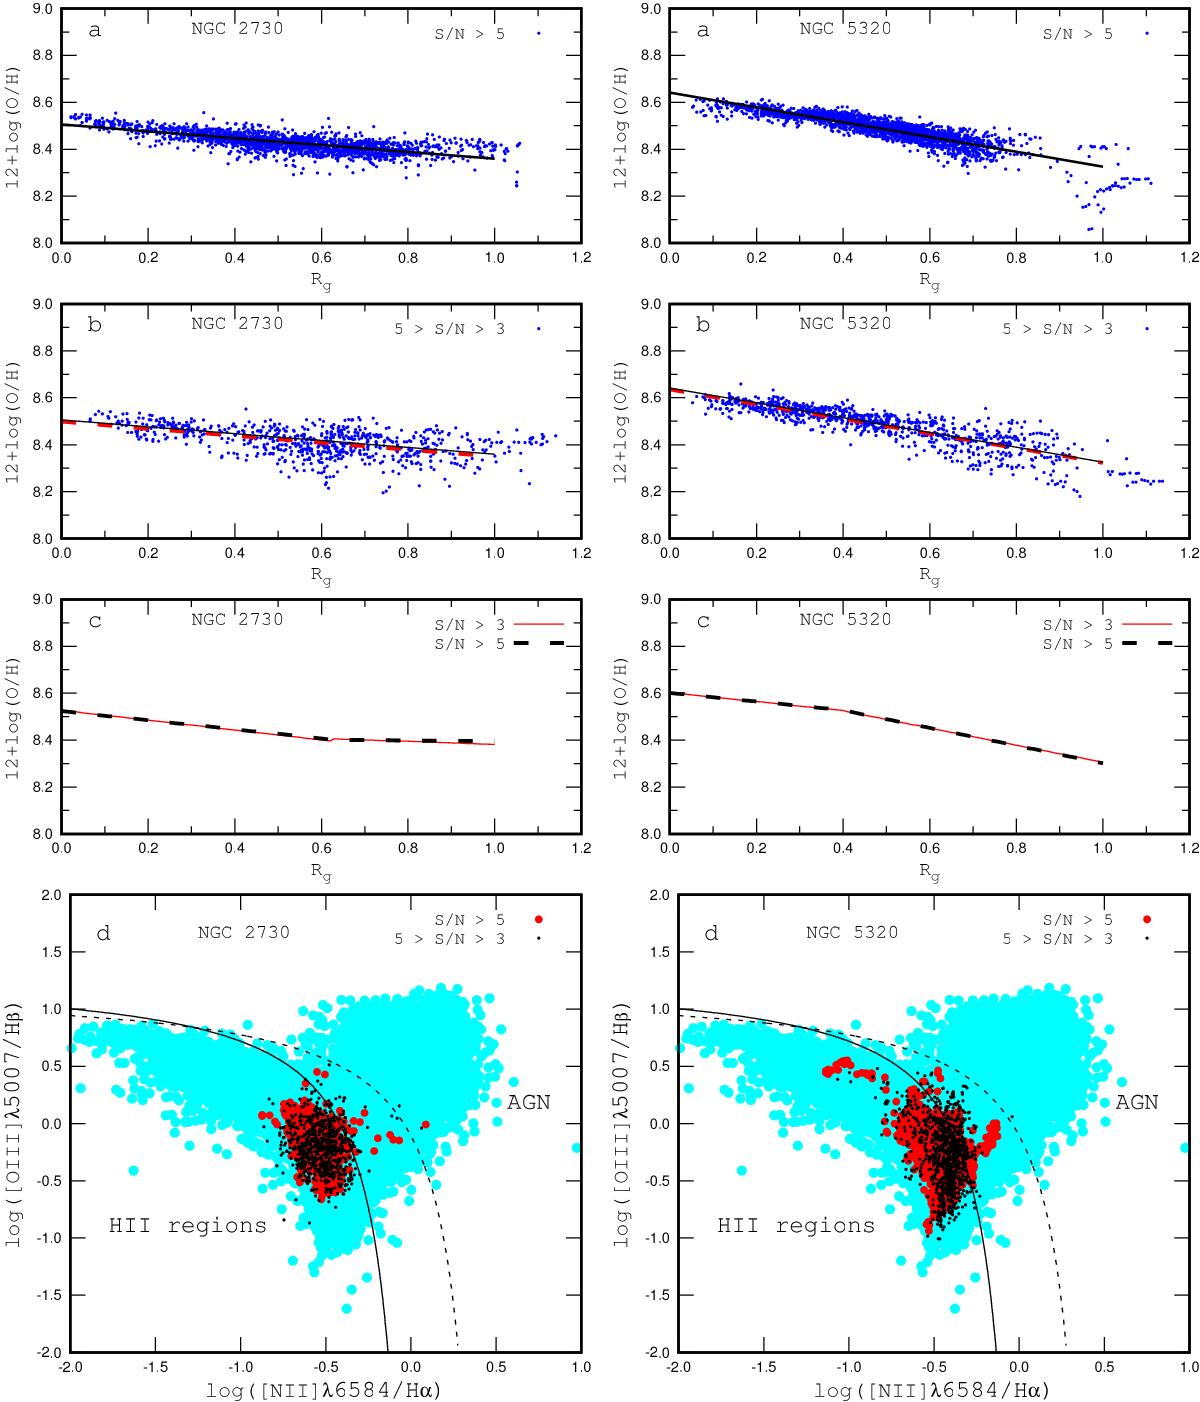
Left column panel: properties of the galaxy NGC 2730. Panela: radial abundance distributions traced by spaxels with high-quality spectra, i.e. with a S/N> 5 for each of the measured emission lines. The points depict individual spaxels. The dark (black) solid line is the linear best fit to those data. Panelb: radial abundance distributions traced by the spaxels with moderate-quality spectra, i.e. with a 5 >S/N> 3 for each of the measured emission lines. The points denote individual spaxels, the dark grey (red) dashed line is the pure linear best fit to those data, and the dark (black) solid line is the same as in panela. Panelc: comparison between the broken linear fits to the data for the specta with S/N> 3 (dark grey (red) solid line) and for the spectra with S/N> 5 (dark (black) dashed line). Paneld: classification [N ii]λ6584/Hα vs. [O iii]λ5007/Hβ diagram. The dark grey (red) points indicate the spaxels with high-quality spectra. The dark (black) points stand for the spaxels with moderate-quality spectra. The solid line separates objects with H ii spectra from those containing an AGN according to Kauffmann et al. (2003), while the dashed line is the same boundary according to Kewley et al. (2001). The grey (light blue) filled circles show a large sample of emission-line SDSS galaxies (Thuan et al. 2010). The right column panels show the same but for the galaxy NGC 5320.
Current usage metrics show cumulative count of Article Views (full-text article views including HTML views, PDF and ePub downloads, according to the available data) and Abstracts Views on Vision4Press platform.
Data correspond to usage on the plateform after 2015. The current usage metrics is available 48-96 hours after online publication and is updated daily on week days.
Initial download of the metrics may take a while.