Fig. 17
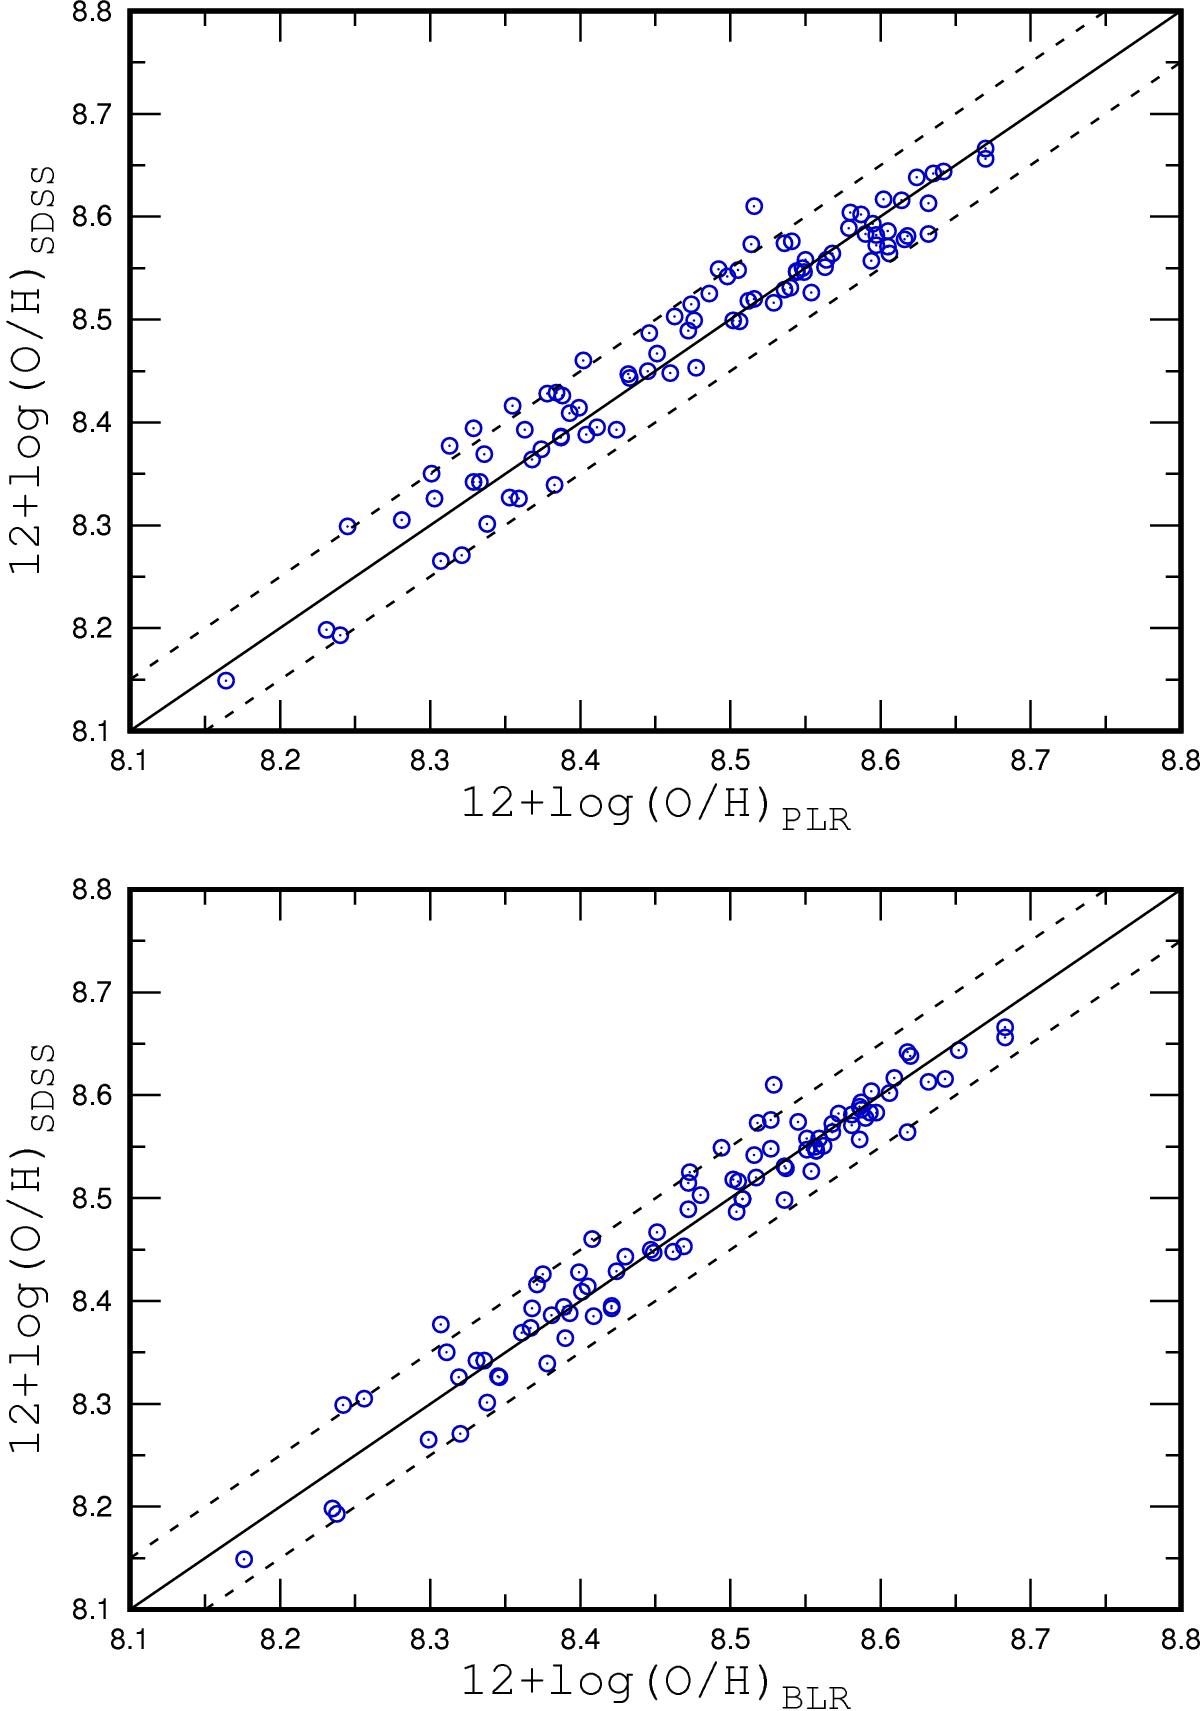
Upper panel: the oxygen abundance (O/H)SDSS determined from the SDSS spectrum vs. abundance (O/H)PLR given by the purely linear O/H – Rg relation at this radius. The solid line indicates equal values. The dashed lines show the ±0.05 dex deviations from unity. Lower panel: the same as the upper panel but for the (O/H)BLR given by the broken linear O/H – Rg relation.
Current usage metrics show cumulative count of Article Views (full-text article views including HTML views, PDF and ePub downloads, according to the available data) and Abstracts Views on Vision4Press platform.
Data correspond to usage on the plateform after 2015. The current usage metrics is available 48-96 hours after online publication and is updated daily on week days.
Initial download of the metrics may take a while.