Fig. 11
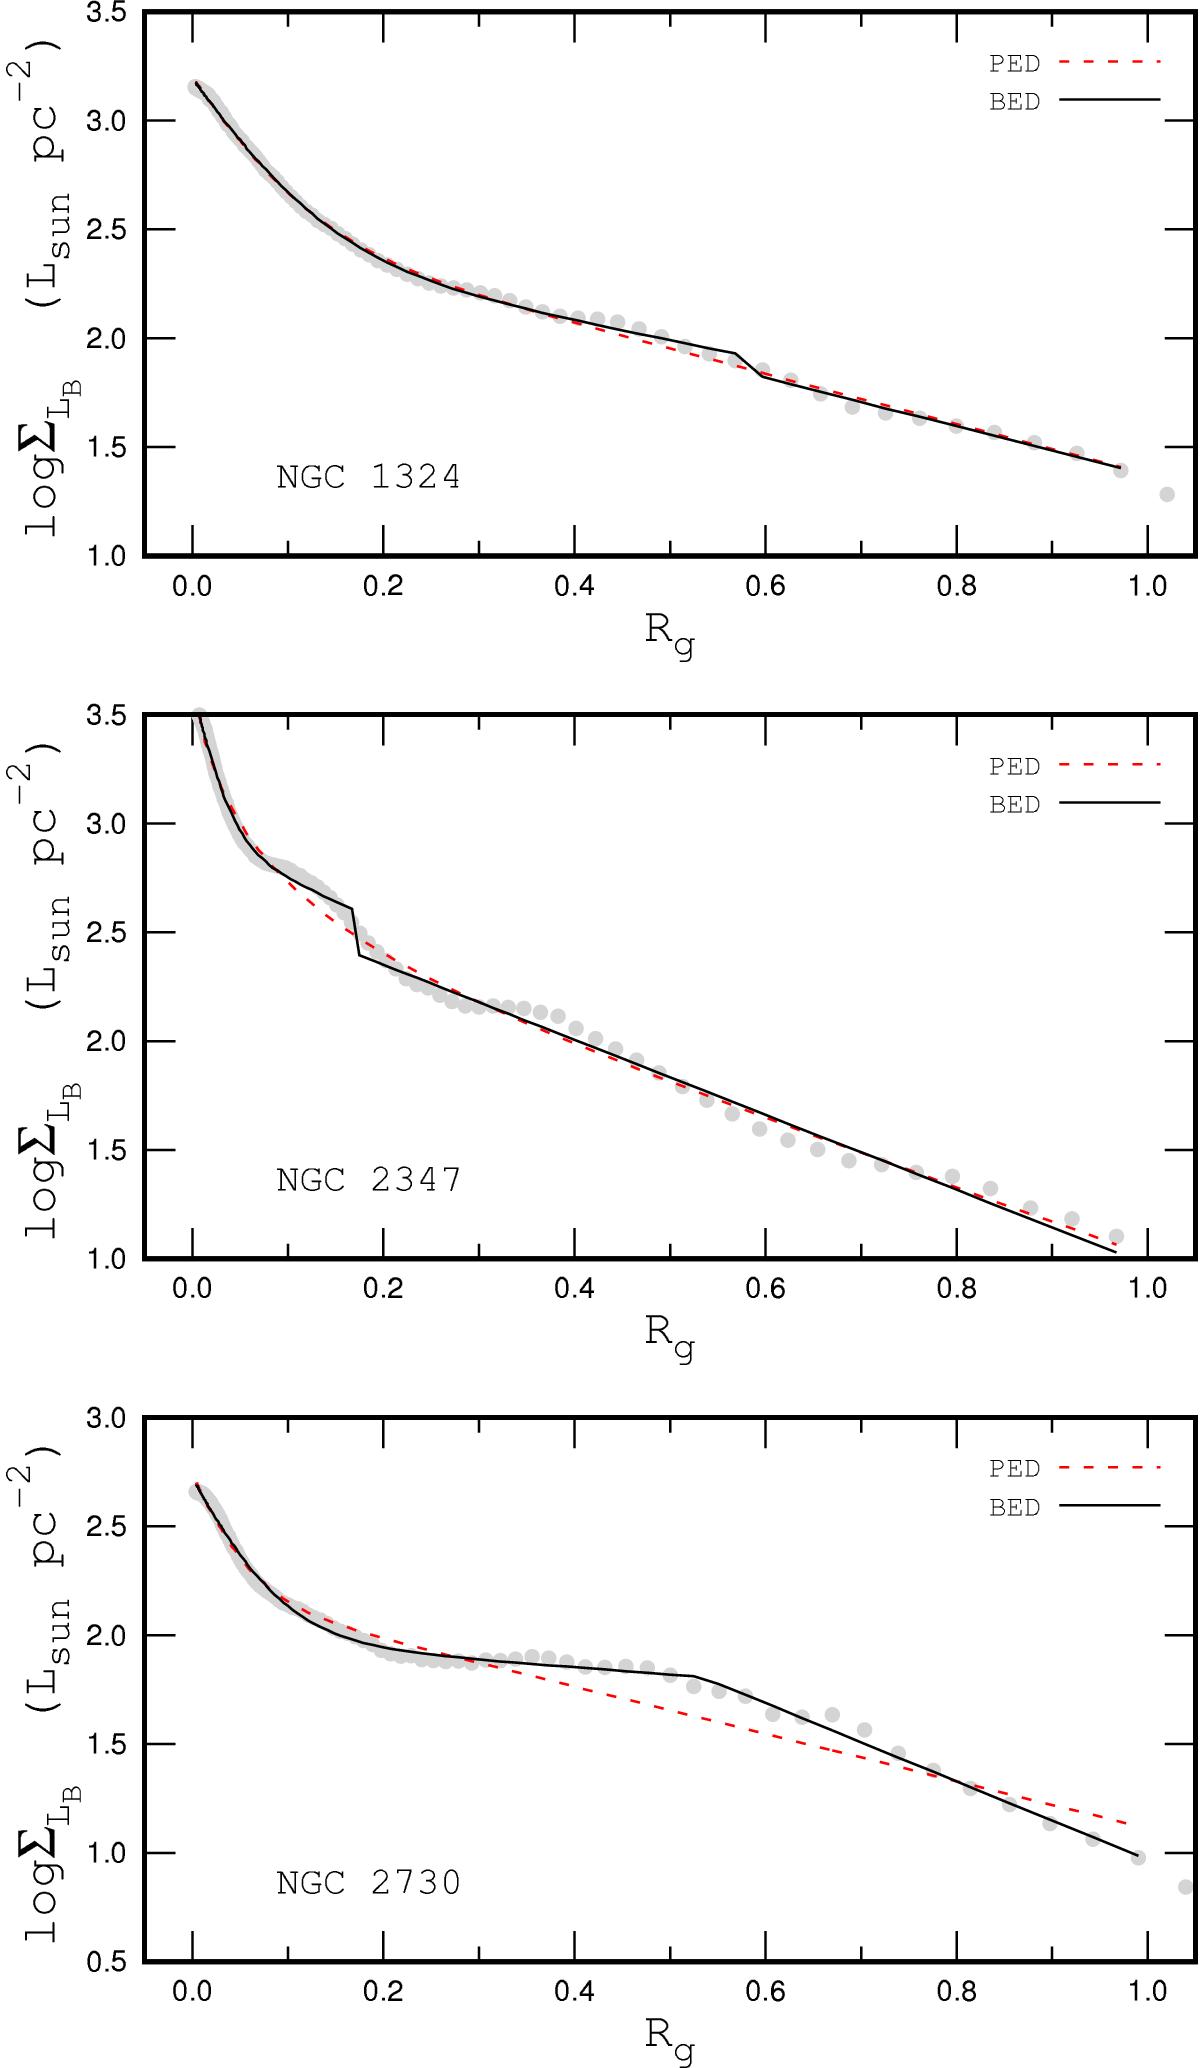
Examples of the observed surface brightness profiles and fits. In each panel, the grey points show the observed surface brightness profile. The dashed (red) line indicates the pure exponential fit to those data. The solid (black) line indicates the broken exponential fit. The upper panel shows the galaxy NGC 1324 with an observed surface brightness profile close to a purely exponential disc. The middle panels shows the galaxy NGC 2347, which exhibits humps and troughs in the observed surface brightness profile. The lower panel shows the galaxy NGC 2730 with a surface brightness profile with a clear break.
Current usage metrics show cumulative count of Article Views (full-text article views including HTML views, PDF and ePub downloads, according to the available data) and Abstracts Views on Vision4Press platform.
Data correspond to usage on the plateform after 2015. The current usage metrics is available 48-96 hours after online publication and is updated daily on week days.
Initial download of the metrics may take a while.