Fig. 9
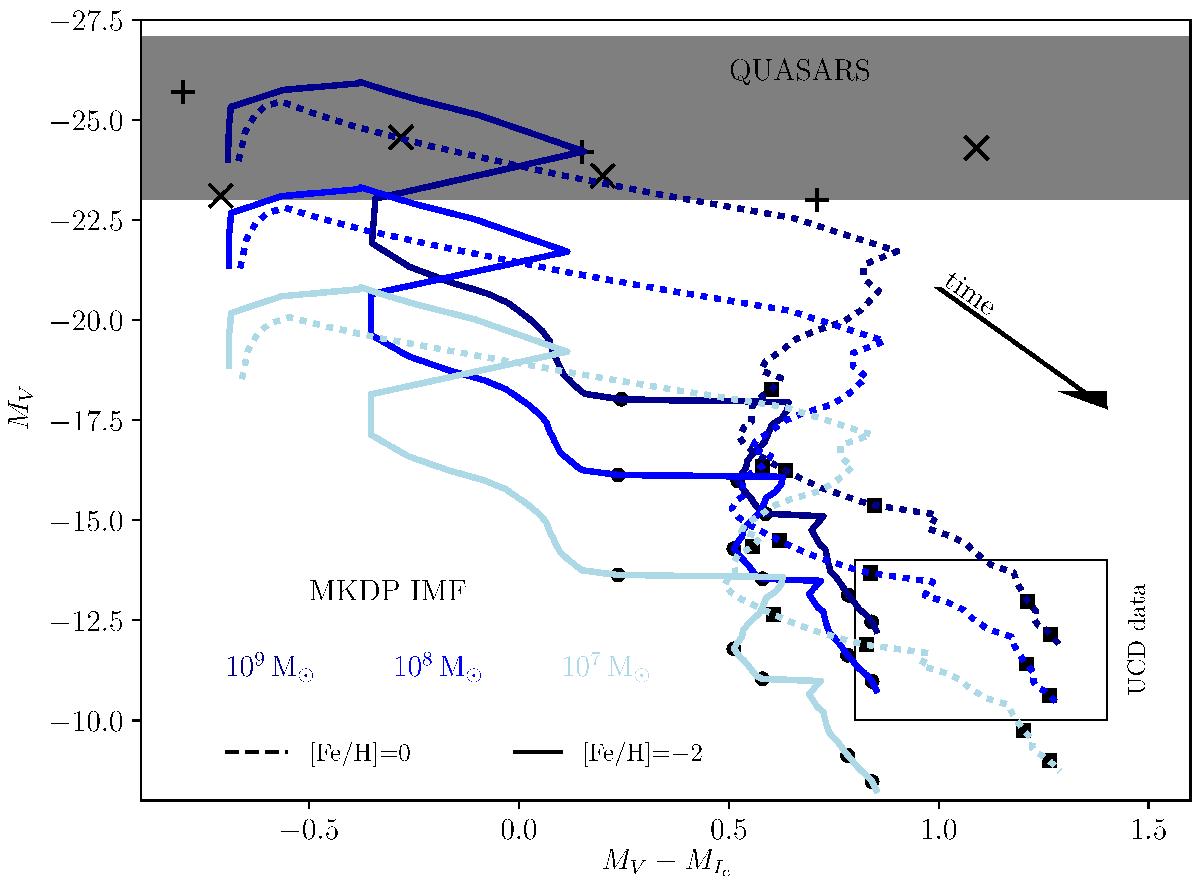
Colour–magnitude diagram showing MV as a function of V−Ic (in the UCD rest frame). These latter are photometric filters directly computed by PEGASE. We consider 107, 108, 109 M⊙ as initial stellar masses, and metallicity values [Fe/H] = −2, 0. Here we show only the results for the MKDP IMF plotted together with the quasar data (black cross and plus markers, cross for radio quiet and plus for radio loud quasars) from Dunlop et al. (1993, 2003), Souchay et al. (2015). The data are compiled in Table 3. The CAN IMF, SAL IMF and vDC IMF are shown in Fig. 10. The arrow indicates the time evolution for the UCD models; the black filled circles and squares mark evolutionary time, from left to right: 100 Myr, 500 Myr, 1 Gyr, 5 Gyr, 10 Gyr for [Fe/H] = −2 and 0 dex. The rectangular region indicates where the majority of observed UCDs are located (e.g. Evstigneeva et al. 2008). Since UCDs have a different metallicity, we do not plot individual data points.
Current usage metrics show cumulative count of Article Views (full-text article views including HTML views, PDF and ePub downloads, according to the available data) and Abstracts Views on Vision4Press platform.
Data correspond to usage on the plateform after 2015. The current usage metrics is available 48-96 hours after online publication and is updated daily on week days.
Initial download of the metrics may take a while.