Fig. 8
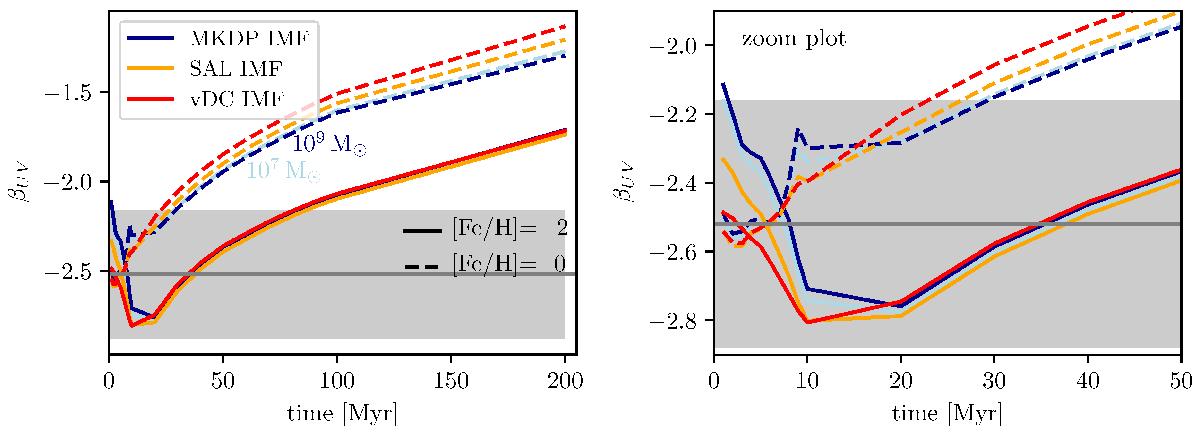
Time evolution of the βUV values fitted over the wavelength interval (1350, 3500) Å to the SEDs in the rest frame of the observed object in units erg-1 cm-2 Å-1. The βUV slope is MUCD-independent, but not for the case of the MKDP IMF for which we plot the case of MUCD = 107 M⊙ and 109 M⊙. Left panel: the time evolution of the βUV slope over the time period of 200 Myr. Right panel: the zoom-in plot covers the first 50 Myr. The grey band shows the measurement from Vanzella et al. (2017) for their object GC1.
Current usage metrics show cumulative count of Article Views (full-text article views including HTML views, PDF and ePub downloads, according to the available data) and Abstracts Views on Vision4Press platform.
Data correspond to usage on the plateform after 2015. The current usage metrics is available 48-96 hours after online publication and is updated daily on week days.
Initial download of the metrics may take a while.