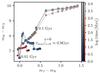
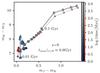
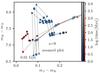
Fig. A.8
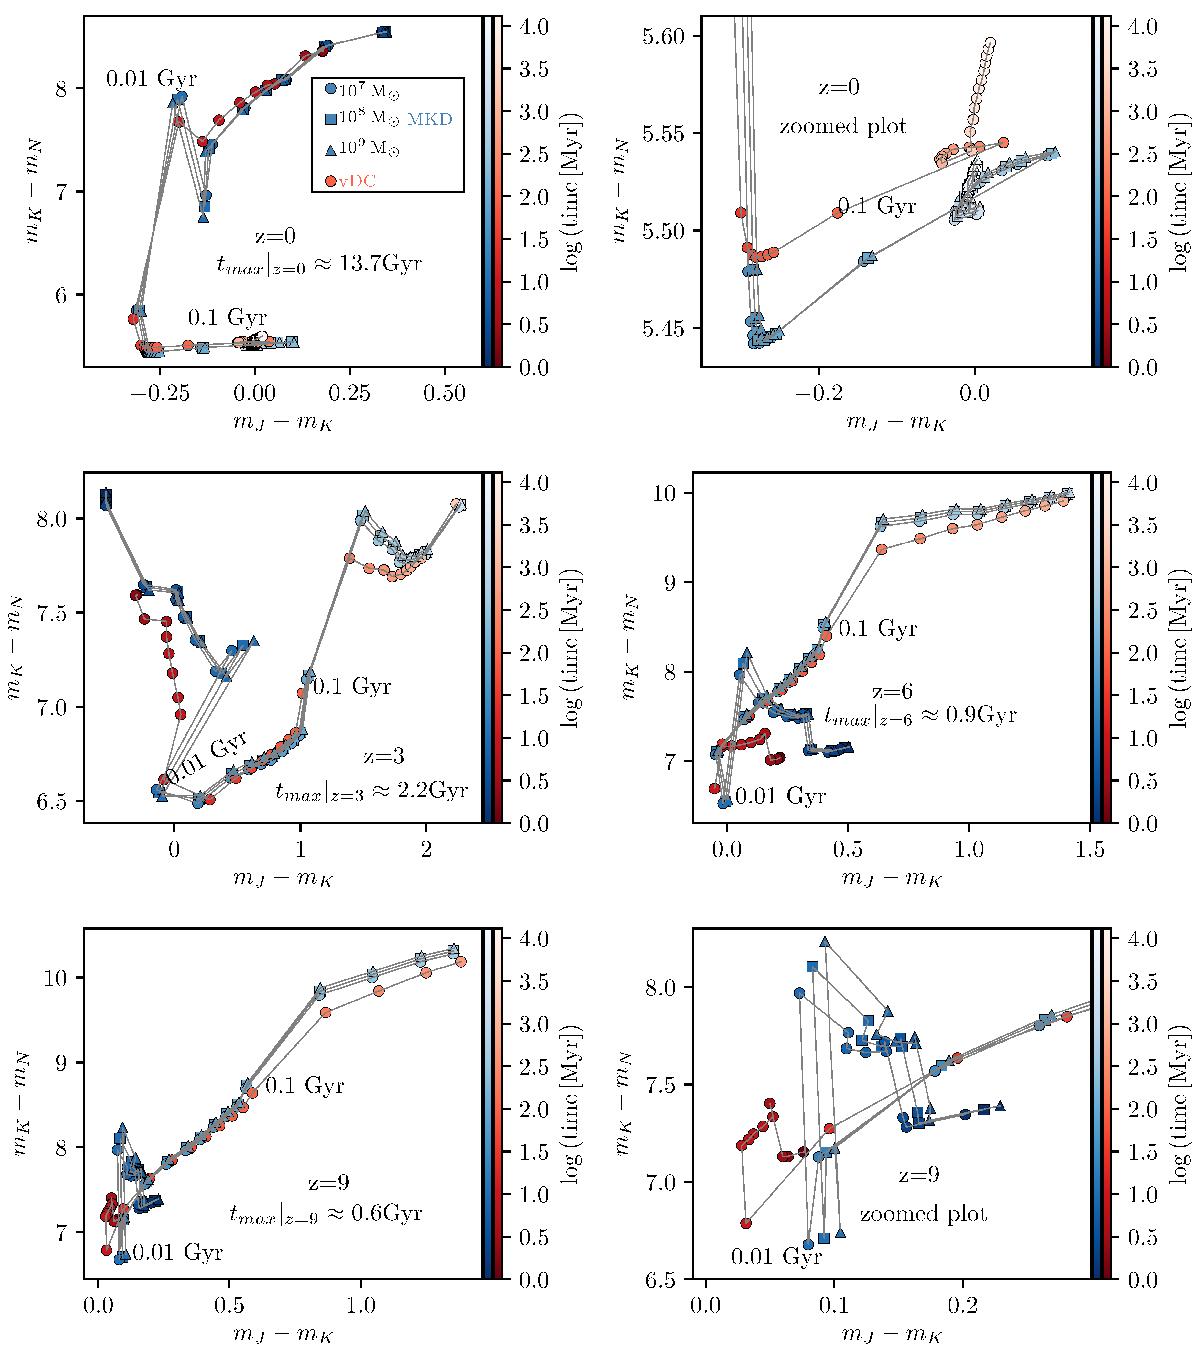
Colour–colour diagram made for standard filters J, K, and N approximated here by rectangular boxes in Fig. A.4 showing the comparison of the vDC IMF and the MKDP IMF for different initial UCD masses, MUCD. Since according to the ΛCDM cosmological model the upper limit to the age of the universe is tmax ≈ 13.7 Gyr, we plot only ages consistent with this constraint on a corresponding redshift (here values are plotted at a redshift of 0, 3, 6, and 9). The age evolution is shown by a colour scale that is the same for all plots.
Current usage metrics show cumulative count of Article Views (full-text article views including HTML views, PDF and ePub downloads, according to the available data) and Abstracts Views on Vision4Press platform.
Data correspond to usage on the plateform after 2015. The current usage metrics is available 48-96 hours after online publication and is updated daily on week days.
Initial download of the metrics may take a while.