Fig. A.7
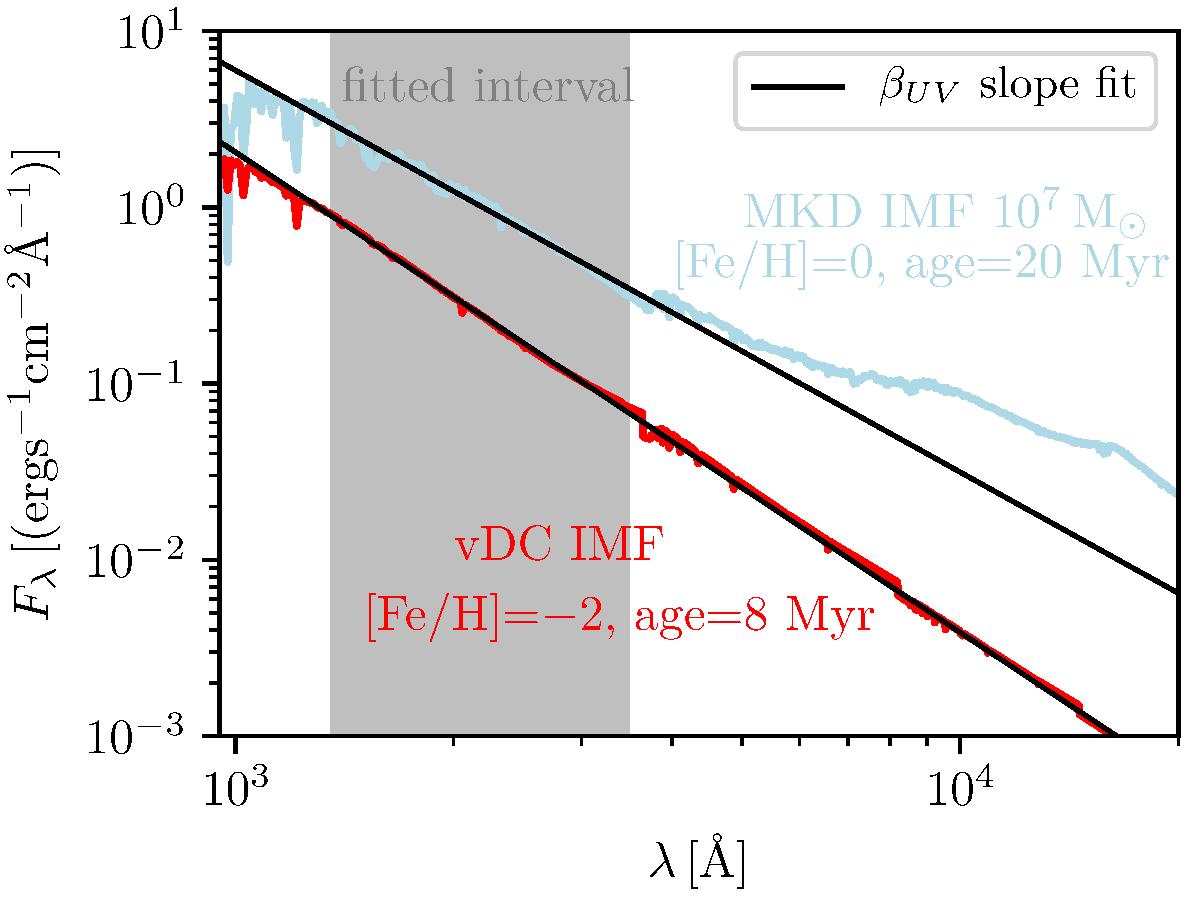
Fit to a SED in the grey shaded region shows the slope βUV for two different UCDs with different age, the same mass 107 M⊙, and different metallicity. We can see that in the grey region the spectra have a smooth shape and therefore it is possible to fit this part by a linear function to obtain a good estimate of βUV. Section 3.4 gives more details.
Current usage metrics show cumulative count of Article Views (full-text article views including HTML views, PDF and ePub downloads, according to the available data) and Abstracts Views on Vision4Press platform.
Data correspond to usage on the plateform after 2015. The current usage metrics is available 48-96 hours after online publication and is updated daily on week days.
Initial download of the metrics may take a while.