Fig. A.3
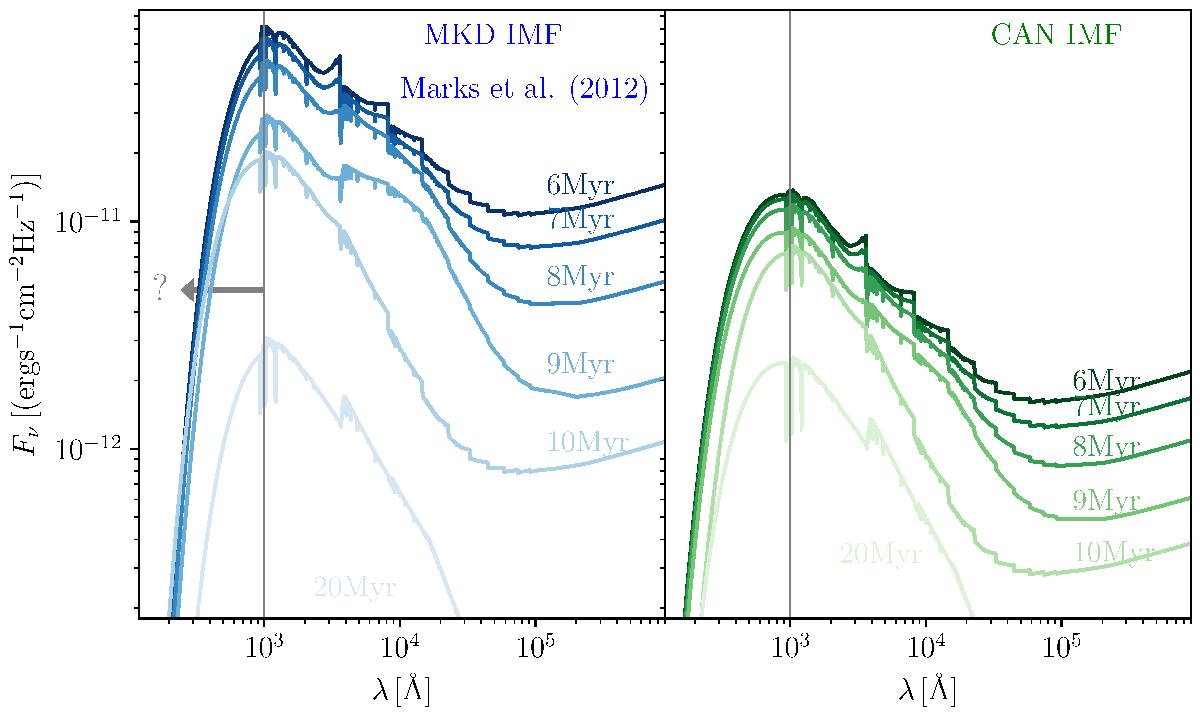
PEGASE time evolution of SEDs for [Fe/H] = −2 and a representative initial stellar mass of 107 M⊙ as if it is at a distance of 10 pc. Since we assume that the star formation lasts for 5 Myr, we start with the SED at 6 Myr to avoid overlapping of lines. Left panel: the evolution for the MKDP IMF. Right panel: the evolution for the CAN IMF. The region below a wavelength of ≈ 1000 Å (marked by arrow and question mark) is the black-body approximation. The PEGASE code does not predict values in this region. More details are given in the text.
Current usage metrics show cumulative count of Article Views (full-text article views including HTML views, PDF and ePub downloads, according to the available data) and Abstracts Views on Vision4Press platform.
Data correspond to usage on the plateform after 2015. The current usage metrics is available 48-96 hours after online publication and is updated daily on week days.
Initial download of the metrics may take a while.