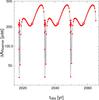
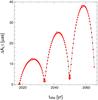
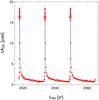
Fig. 5

Astrometric impact of different effects on the S2 star observations obtained during three periods. First plot: Roemer time delay. Second plot: Shapiro time delay. Third plot: Lense-Thirring effect considering the angular momentum parameters a = 0.99, i′ = 45° and Ω′ = 160°. Fourth plot: gravitational lensing. Open red circles and triangles denote the position of the apocenter and the pericenter, respectively. See Appendix E.2 for the precise definition of the various quantities used in these plots.

Current usage metrics show cumulative count of Article Views (full-text article views including HTML views, PDF and ePub downloads, according to the available data) and Abstracts Views on Vision4Press platform.
Data correspond to usage on the plateform after 2015. The current usage metrics is available 48-96 hours after online publication and is updated daily on week days.
Initial download of the metrics may take a while.