Fig. 4
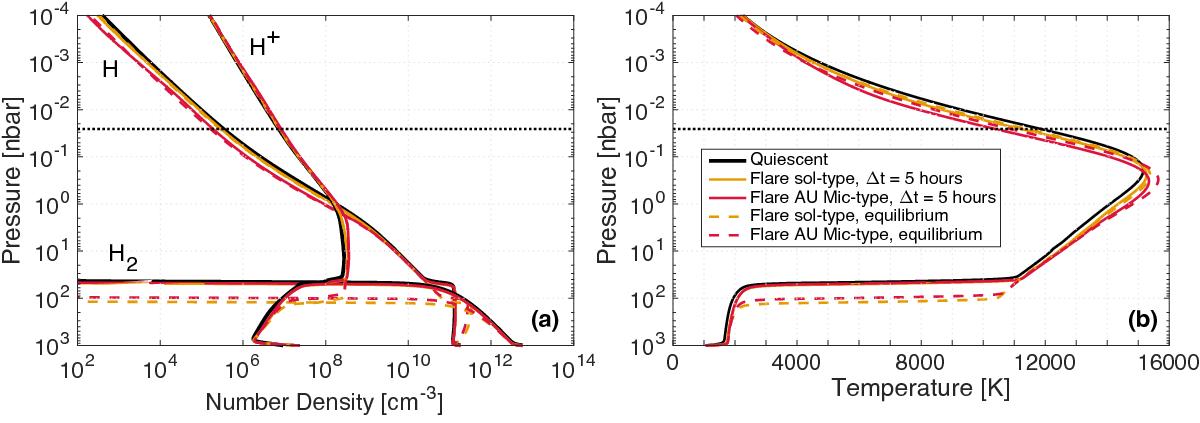
Comparison of H+, H, H2 densities (panel a) and temperature (panel b) profiles in the thermosphere of HD 189733b. These are obtained from the thermospheric model driven by a quiescent spectrum (in black), by flaring spectra for a duration of 5 h (coloured, solid lines), and by the flaring spectra to equilibrium (coloured, dashed lines). The orange and red lines correspond to the cases of solar-type and AU Mic-type flares, respectively. The dotted horizontal black line in each panel represents the pressure level corresponding to 2.95 Rp, the lower boundary of the Bourrier & Lecavelier des Etangs (2013) model.
Current usage metrics show cumulative count of Article Views (full-text article views including HTML views, PDF and ePub downloads, according to the available data) and Abstracts Views on Vision4Press platform.
Data correspond to usage on the plateform after 2015. The current usage metrics is available 48-96 hours after online publication and is updated daily on week days.
Initial download of the metrics may take a while.