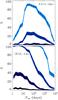
Fig. 5

Detected fractions in the HE (left panels) and VHE (right panels) surveys. Each panel contains four curves corresponding to Pinj = 1033,1034,1035,1036 erg/s (dark to light blue sequence in each panel). The detection fraction increases when going from small Pinj (darker blue) to high Pinj (lighter blue) until the detected fraction saturates at the value given by the observable fraction (Table 2).
Current usage metrics show cumulative count of Article Views (full-text article views including HTML views, PDF and ePub downloads, according to the available data) and Abstracts Views on Vision4Press platform.
Data correspond to usage on the plateform after 2015. The current usage metrics is available 48-96 hours after online publication and is updated daily on week days.
Initial download of the metrics may take a while.