Free Access
Fig. 9
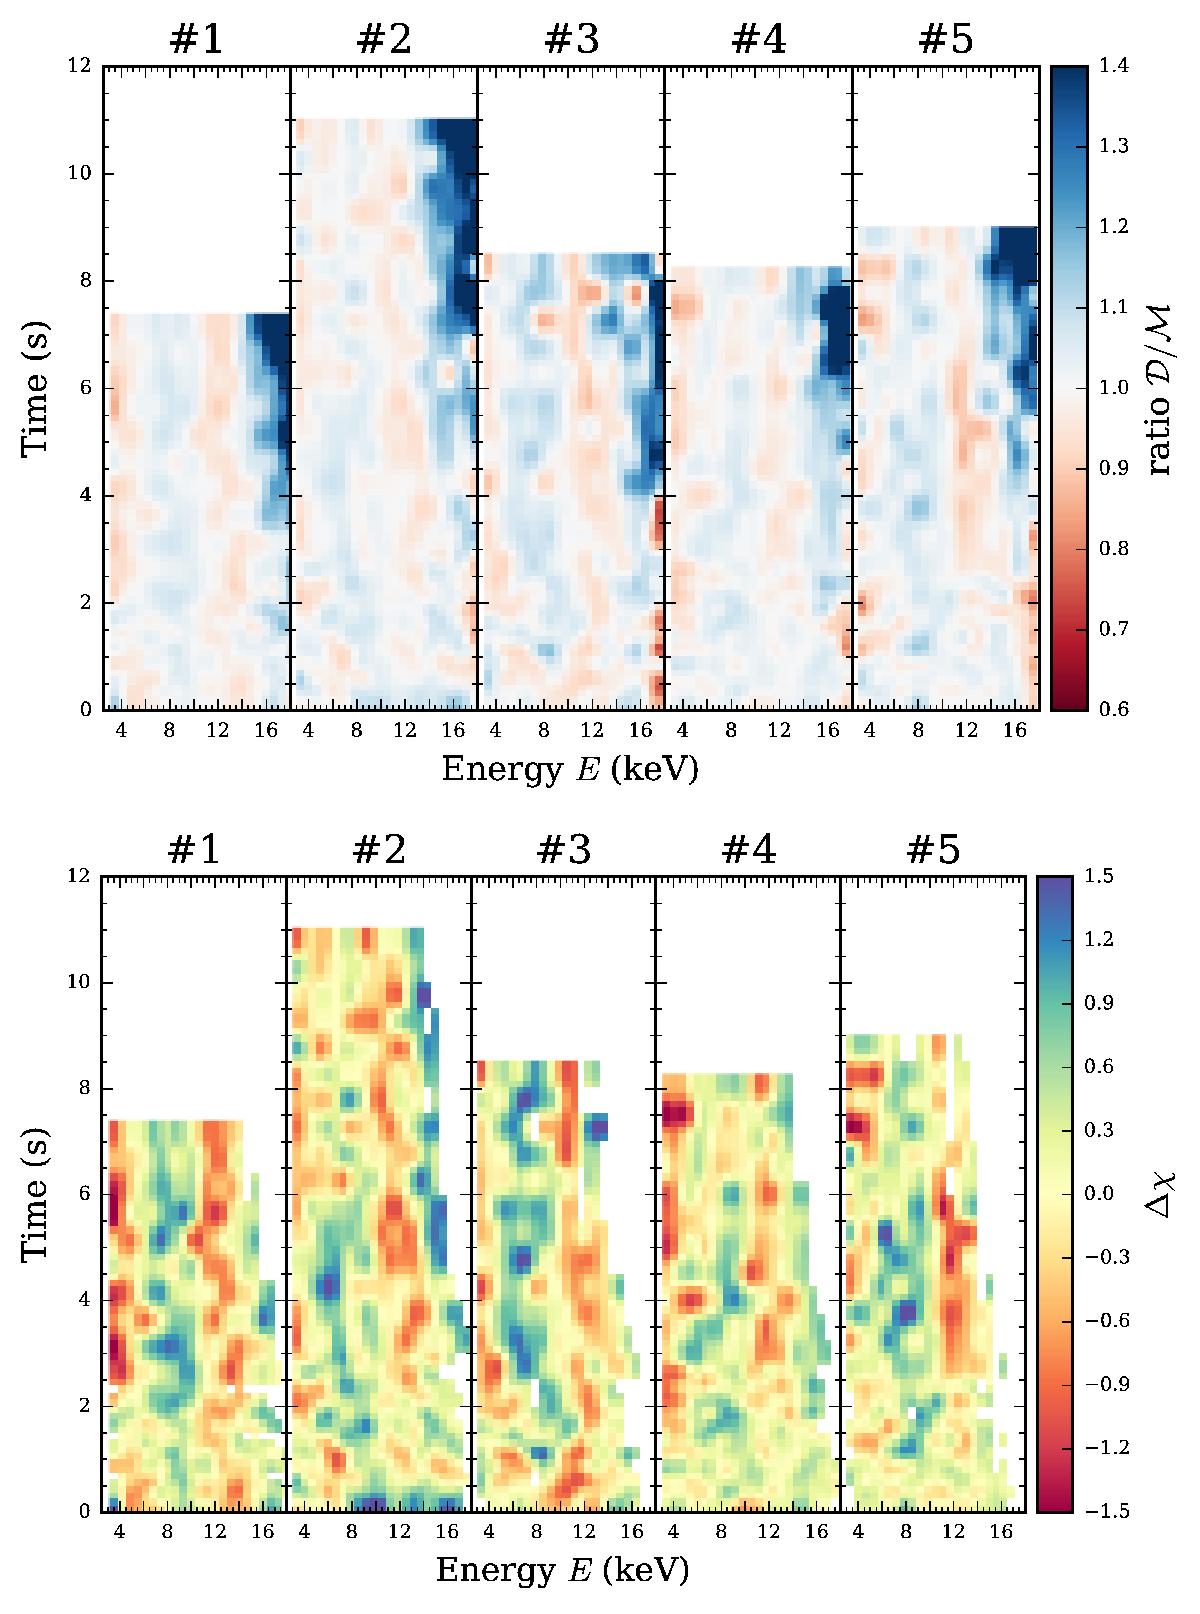
Upper panel: ratio of the data to the best-fit model for the time-resolved spectra of five bursts from 4U 1702−429 for Model D. Lower panel: deviation Δχ of the data from the model. Only energy bins where the number of counts exceeds 50 are shown.
This figure is made of several images, please see below:
Current usage metrics show cumulative count of Article Views (full-text article views including HTML views, PDF and ePub downloads, according to the available data) and Abstracts Views on Vision4Press platform.
Data correspond to usage on the plateform after 2015. The current usage metrics is available 48-96 hours after online publication and is updated daily on week days.
Initial download of the metrics may take a while.