Fig. 8
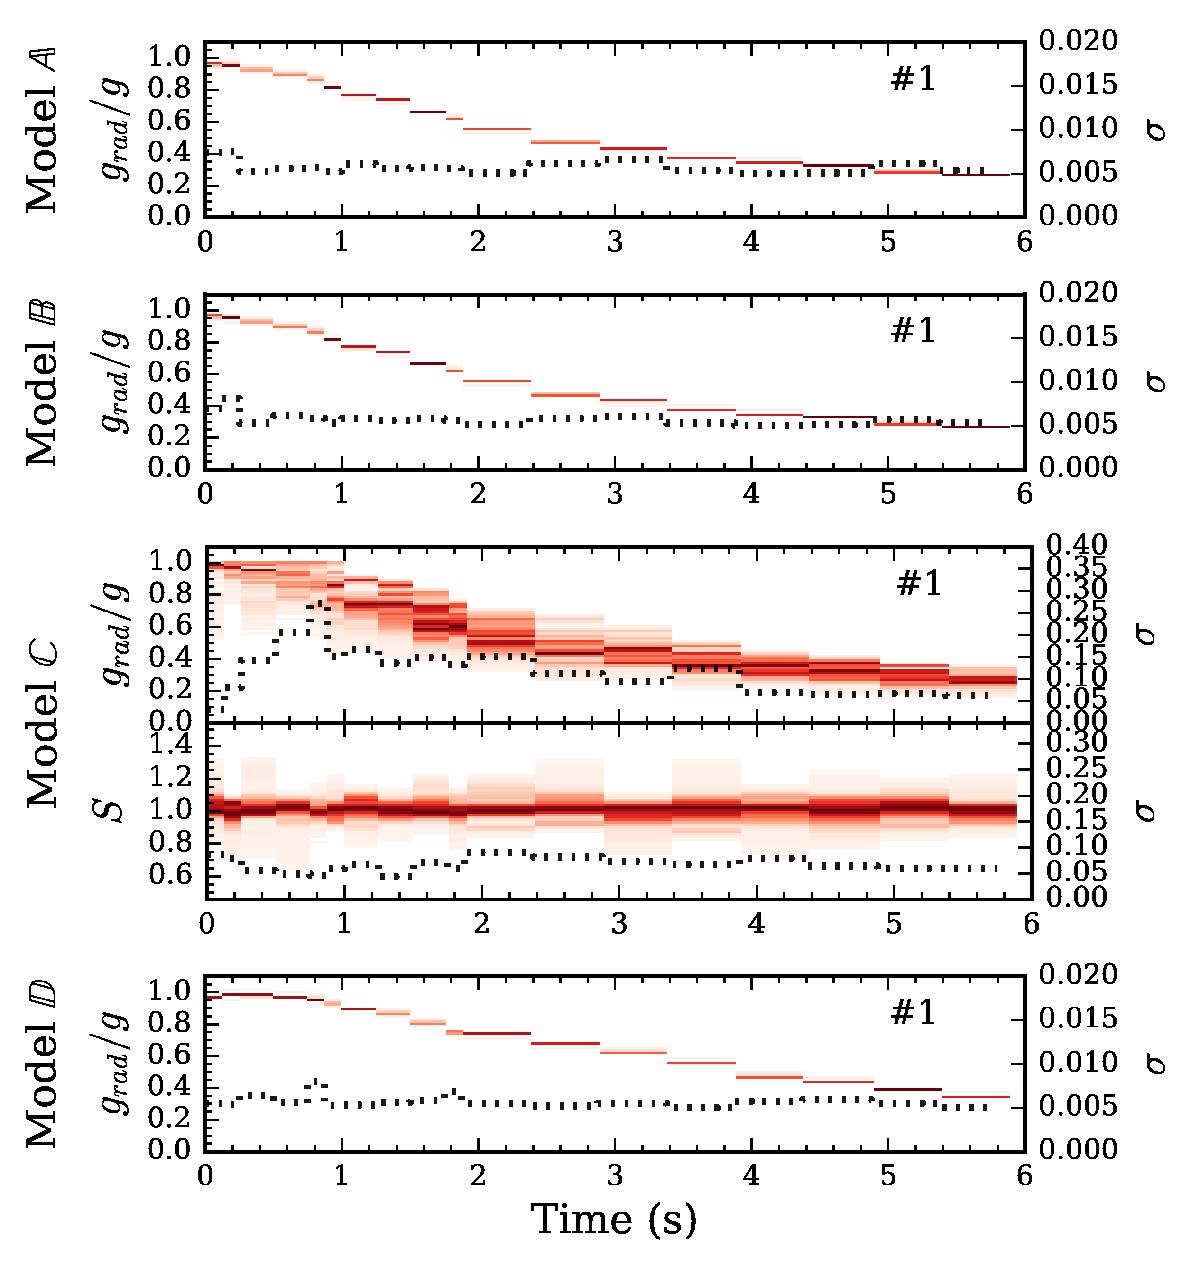
Evolution of the normalized luminosity grad/g for burst 1 from 4U 1702−429. The surface fraction Sf constraints are also shown for model C, which is the only one of our models in which this parameter is free. The dotted black line with the scale on the right axis shows the corresponding standard deviation of the obtained parameter distributions. The intensity of the red coloring is proportional to the probability density. The constraints we find using these real RXTE data bear a clear similarity to the constraints from our synthetic data fits seen in Fig. 2.
Current usage metrics show cumulative count of Article Views (full-text article views including HTML views, PDF and ePub downloads, according to the available data) and Abstracts Views on Vision4Press platform.
Data correspond to usage on the plateform after 2015. The current usage metrics is available 48-96 hours after online publication and is updated daily on week days.
Initial download of the metrics may take a while.