Fig. 4
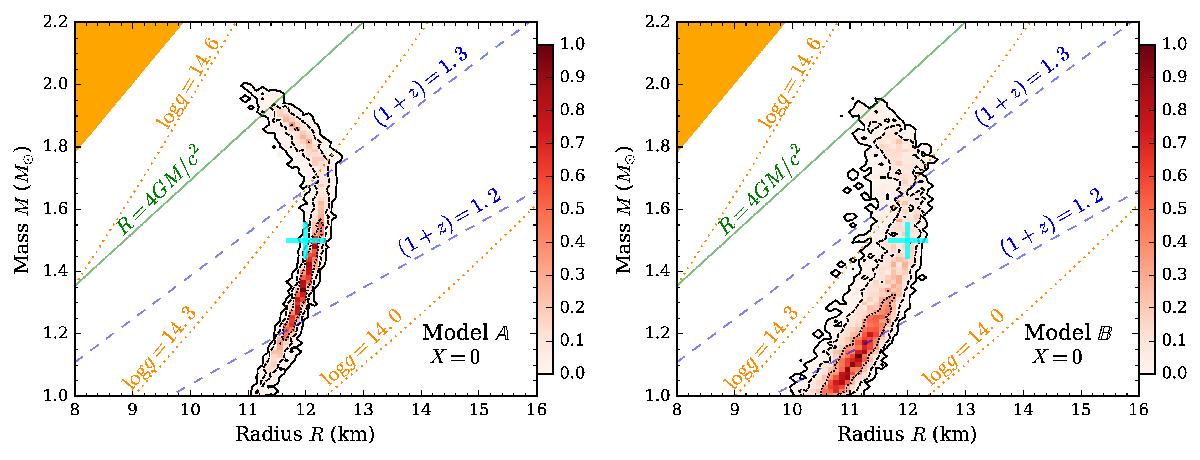
Mass and radius posteriors for synthetic data created for R = 12 km and M = 1.5 M⊙, which are shown here with cyan crosses. The left panel shows a spectral fit with fixed emitting area Sf = 1 and hydrogen mass fraction X = 0 (model A). The right panel shows a spectral fit with a free hydrogen fraction X (model B). In both panels, the dotted line encapsulates the 68%, the dashed line the 95%, and the solid line the 99.7% credible regions. The dashed blue lines show values of constant redshift: 1 + z = 1.2 and 1.3. The dotted orange lines are the contours of constant surface gravity: log g = 14.0, 14.3 and 14.6. The solid green line shows the critical radius R = 4GM/c2. The dark orange region in the top left corner marks the region of parameter space forbidden by the requirement of causality (Haensel et al. 2007; Lattimer & Prakash 2007). The input (M,R) point is within the 95% credible regions in both cases, even when the hydrogen mass fraction is a free parameter.
Current usage metrics show cumulative count of Article Views (full-text article views including HTML views, PDF and ePub downloads, according to the available data) and Abstracts Views on Vision4Press platform.
Data correspond to usage on the plateform after 2015. The current usage metrics is available 48-96 hours after online publication and is updated daily on week days.
Initial download of the metrics may take a while.