Fig. 3
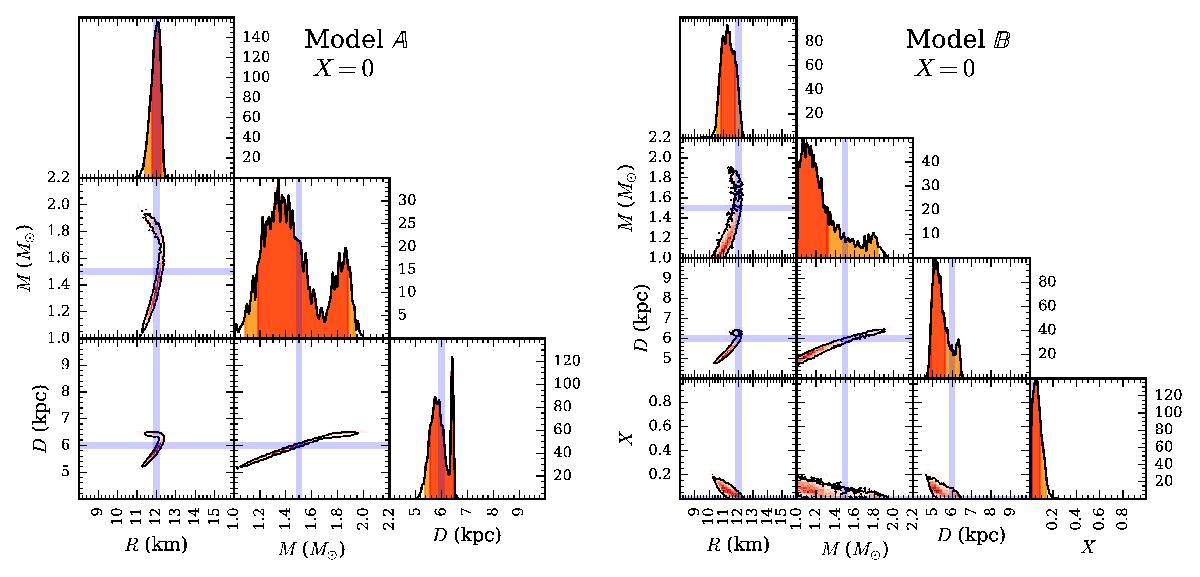
Posterior distributions for the MCMC run with synthetic data for models A and B. The top panels of the triangles show the marginalized parameter posteriors (in arbitrary units); here the dark and light orange shadings give the 68% and 95% credible regions. The lower panels show the projected two-dimensional parameter posteriors against each other. For these panels the solid line encloses the 95% credible regions. The blue stripes show the original values of the synthetic data that were used to create the data: R = 12 km, M = 1.5 M⊙, X = 0, and D = 6 kpc. If the composition is known, the radius is precisely recovered. When X is a free parameter, the prior limit of X > 0 and the correlation of M, X, and D with each other leads to asymmetric posteriors around the true value, and so the inferred radius is a lower limit.
Current usage metrics show cumulative count of Article Views (full-text article views including HTML views, PDF and ePub downloads, according to the available data) and Abstracts Views on Vision4Press platform.
Data correspond to usage on the plateform after 2015. The current usage metrics is available 48-96 hours after online publication and is updated daily on week days.
Initial download of the metrics may take a while.