Fig. 2
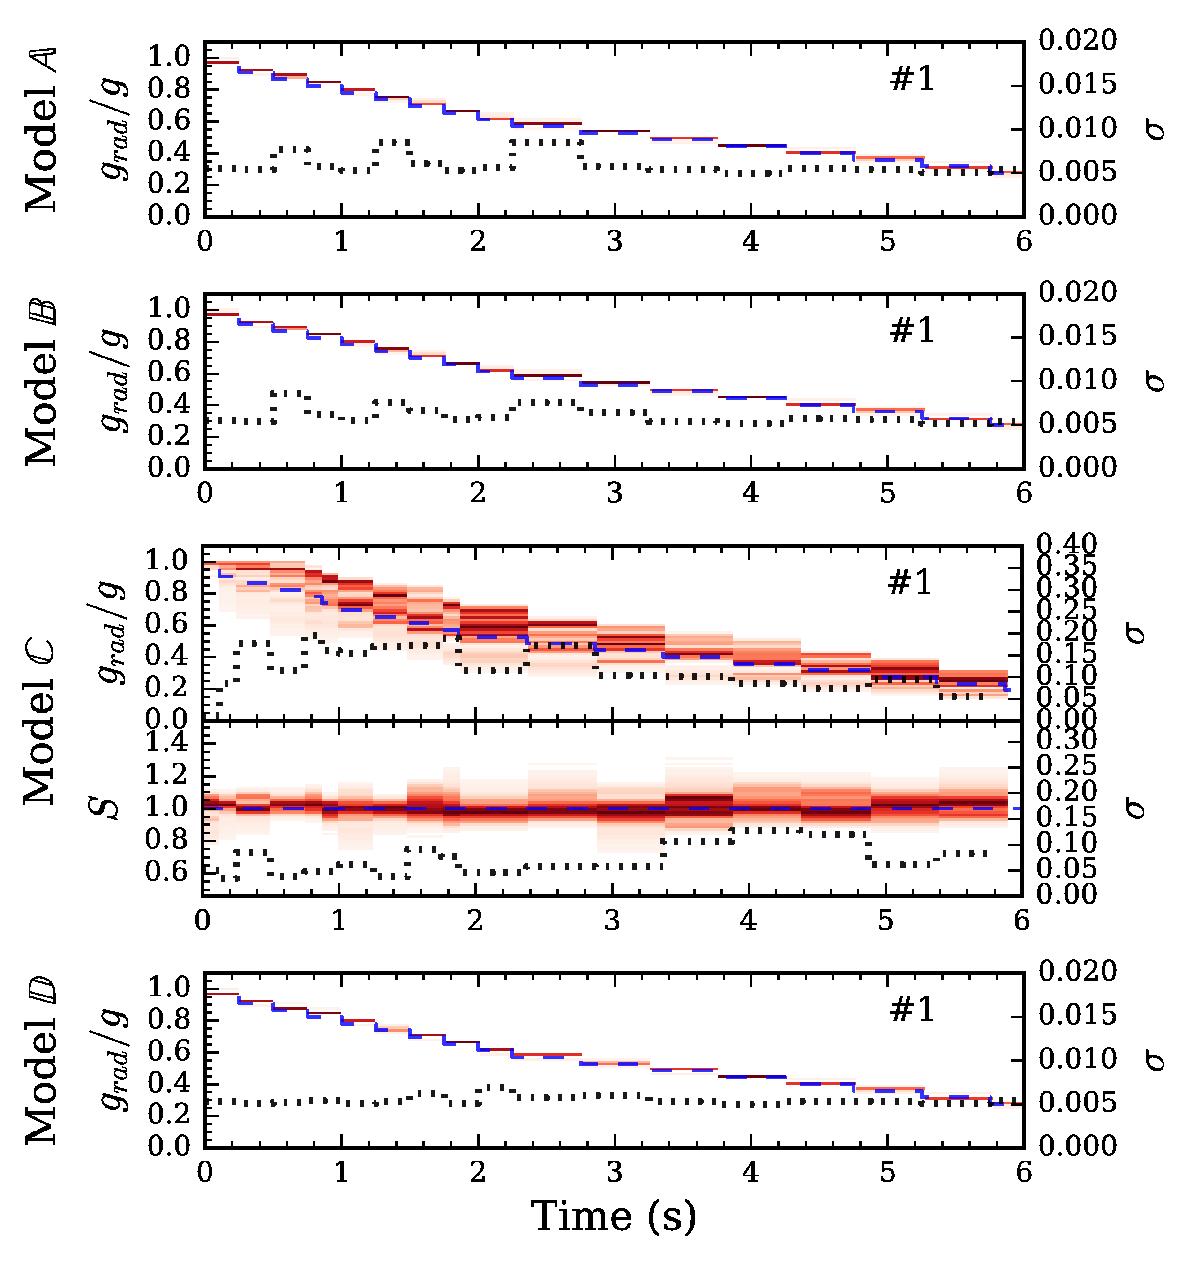
Evolution of the normalized luminosity grad/g for burst 1 of the synthetic data. Constraints on the surface fraction Sf are also shown for model C, which is the only one of our models in which this parameter is free. The dotted black line with the scale on the right axis shows the corresponding standard deviation of the obtained parameter distributions. The blue dashed line shows the input value used to create the data. The intensity of the red coloring is proportional to the probability density. This figure shows that when the fitting model is consistent with the model used to produce the data, we obtain parameter values that are accurate and precise.
Current usage metrics show cumulative count of Article Views (full-text article views including HTML views, PDF and ePub downloads, according to the available data) and Abstracts Views on Vision4Press platform.
Data correspond to usage on the plateform after 2015. The current usage metrics is available 48-96 hours after online publication and is updated daily on week days.
Initial download of the metrics may take a while.