Fig. 10
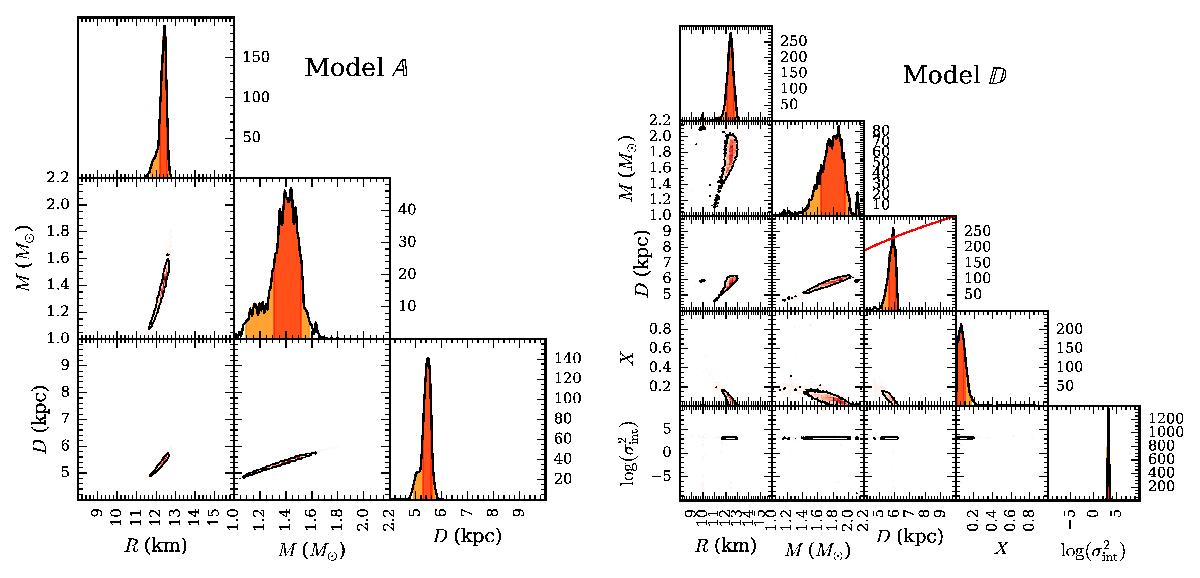
Posterior distributions for the MCMC runs with real data for five PRE bursts from 4U 1702−429. The panels and symbols are the same as in Figs. 3 and 5. The red solid line in the Dpanel shows the prior distribution (![]() ) that we used. Both models are seen to produce posterior shapes that are similar to what we found in our synthetic data fits (Fig. 5). Both models also produce consistent estimates for the radius and distance.
) that we used. Both models are seen to produce posterior shapes that are similar to what we found in our synthetic data fits (Fig. 5). Both models also produce consistent estimates for the radius and distance.
Current usage metrics show cumulative count of Article Views (full-text article views including HTML views, PDF and ePub downloads, according to the available data) and Abstracts Views on Vision4Press platform.
Data correspond to usage on the plateform after 2015. The current usage metrics is available 48-96 hours after online publication and is updated daily on week days.
Initial download of the metrics may take a while.