Fig. 6
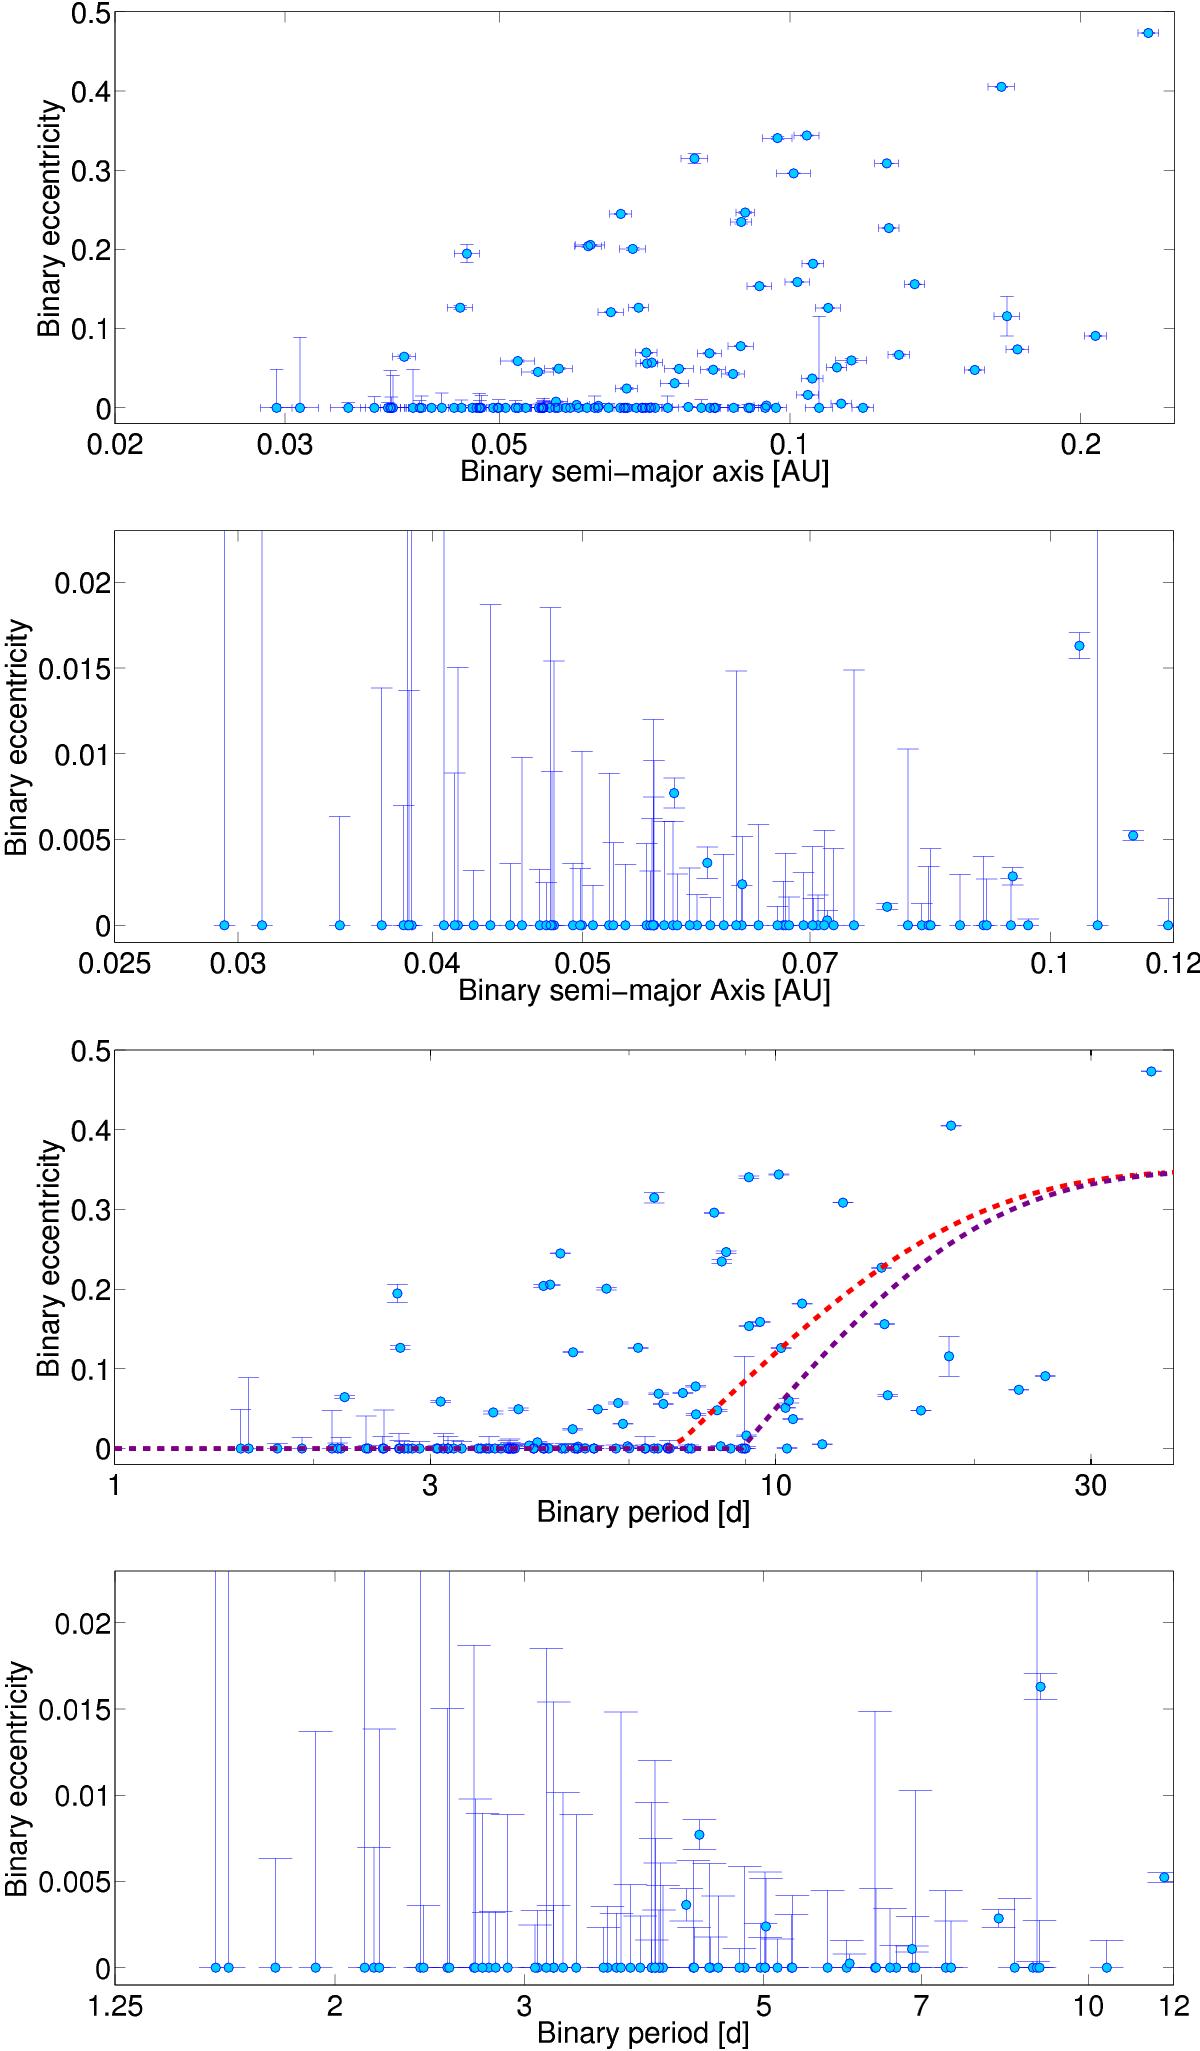
Eccentricity of the eclipsing binary as a function of semi-major axis (top two plots) and period (bottom two plots). Plots b and d are zoomed versions of the a and c, respectively, showing the tightest binaries (Pbin< 12 d) with eccentricities compatible with zero. In the top plot the error in semi-major axis is shown, but this is excluded in the zoomed version for clarity. In the third figure (period vs. eccentricity, not zoomed) we use dashed lines to denote fits using the Meibom & Mathieu function in Eq. (11). The purple dashed line is a fit to all of the data where Pcut = 8.9 days, whilst the red dashed line is a fit to all binaries with M1< 1.3 M⊙ and no sign of a tertiary companion. In this latter case Pcut = 7.0 days.
Current usage metrics show cumulative count of Article Views (full-text article views including HTML views, PDF and ePub downloads, according to the available data) and Abstracts Views on Vision4Press platform.
Data correspond to usage on the plateform after 2015. The current usage metrics is available 48-96 hours after online publication and is updated daily on week days.
Initial download of the metrics may take a while.