Fig. 5
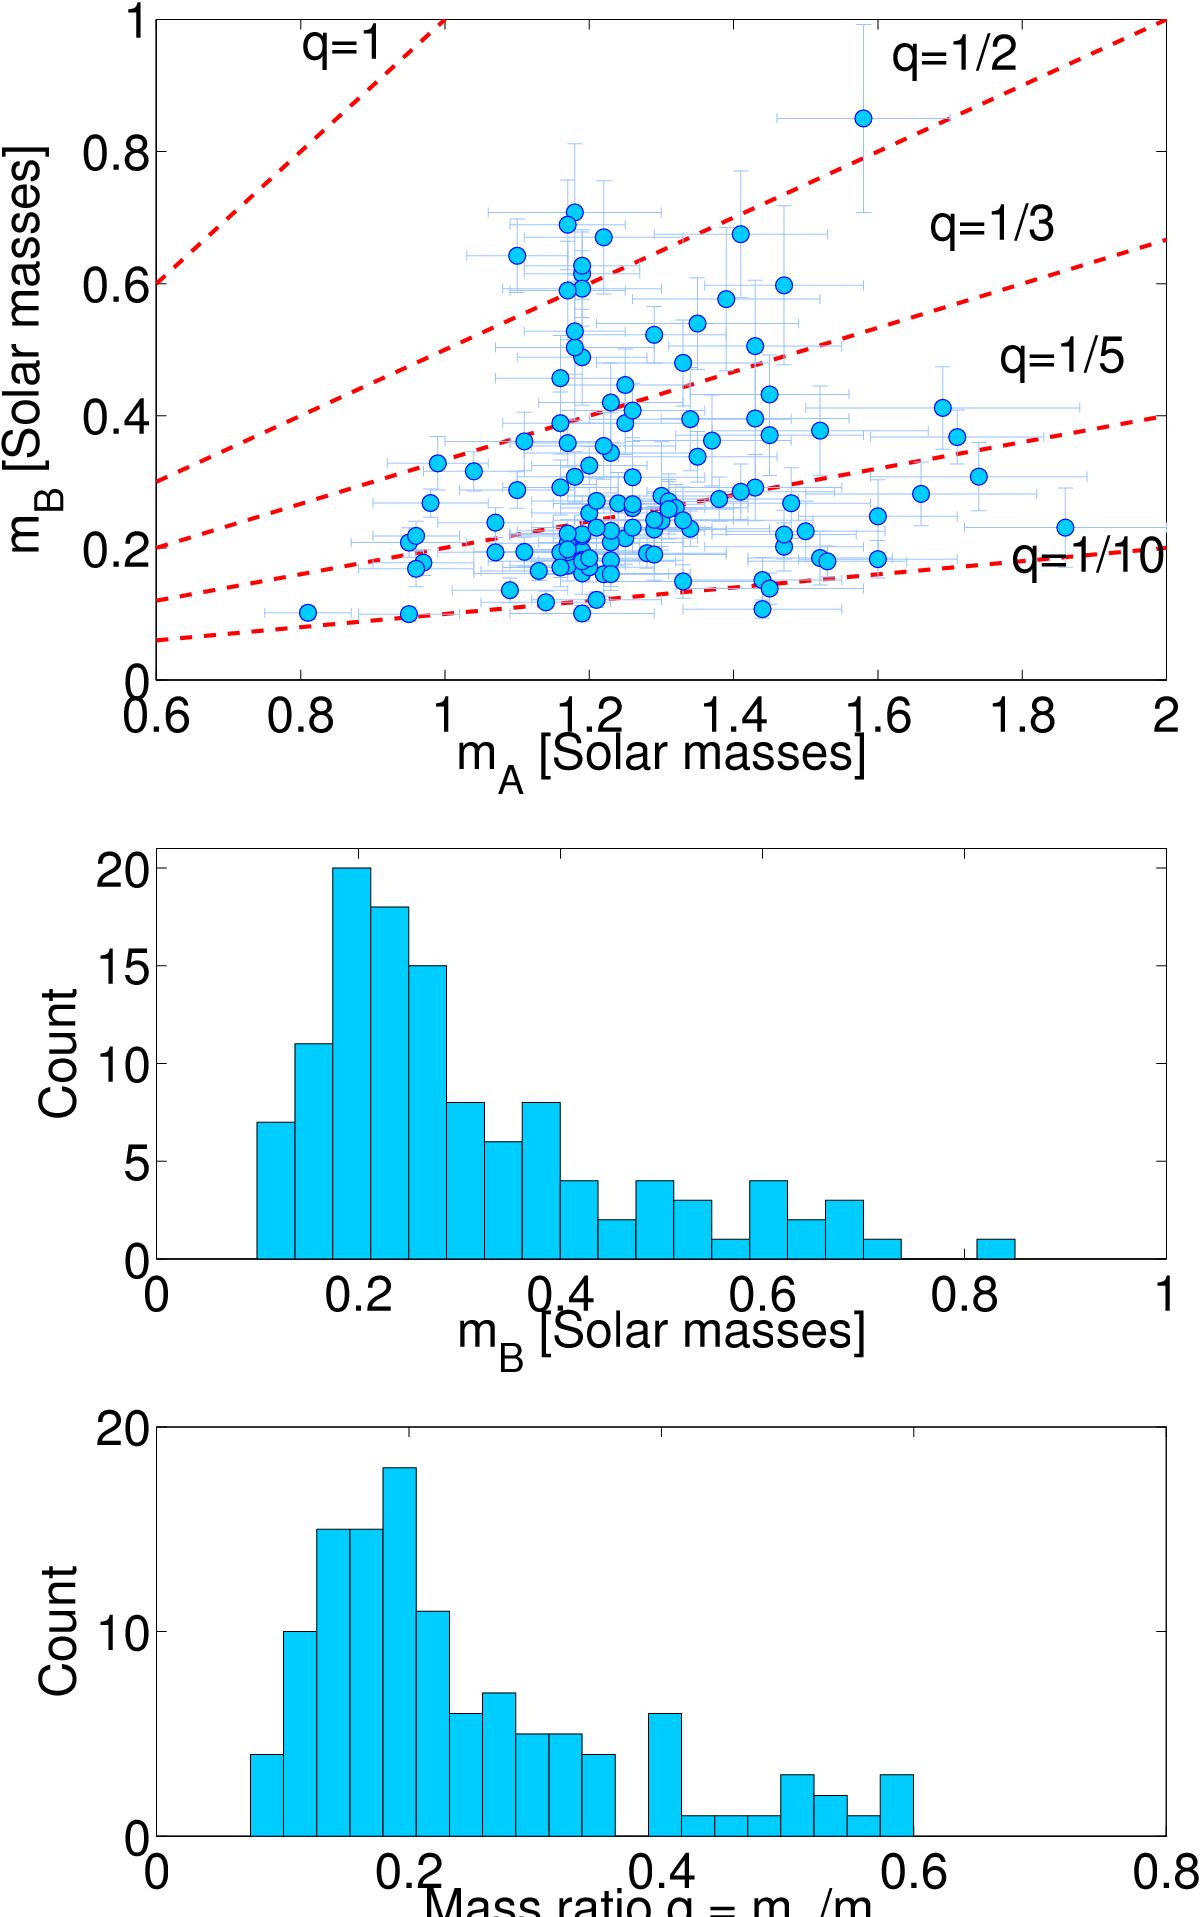
Top: mass ratio q = mA/mB for each of the binaries including error bars. The fractional error of the secondary is generally similar to that of the primary, and consequently the absolute error for the secondary is invisibly small on this plot for small mB. Red dashed lines correspond to mass ratios of 1, 1/2, 1/3, 1/5 and 1/10. Middle: histogram of the secondary mass. Bottom: histogram of the mass ratio.
Current usage metrics show cumulative count of Article Views (full-text article views including HTML views, PDF and ePub downloads, according to the available data) and Abstracts Views on Vision4Press platform.
Data correspond to usage on the plateform after 2015. The current usage metrics is available 48-96 hours after online publication and is updated daily on week days.
Initial download of the metrics may take a while.