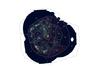
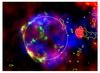
Fig. 9
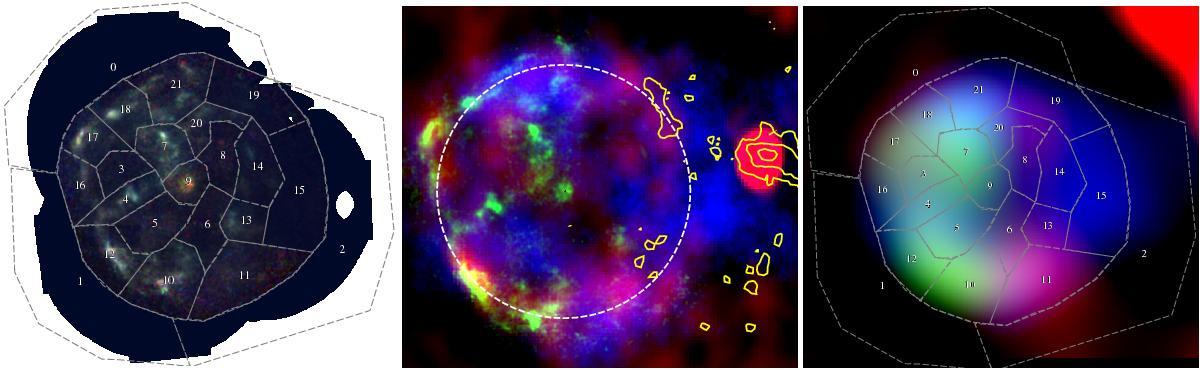
X-ray image screened for point source contribution and corrected for the identified background components and absorption representing the intrinsic source flux (left panel). The bright blob in the centre of the X-ray shell is due to residual emission from the bright CCO. A comparison of the SNR shell morphology in radio (red, GMRT), X-ray (green, XMM-Newton), and TeV (blue, HESS) bands is shown in the middle and right panels. The dashed circle centred on the CCO indicates an approximate extension of the SNR shell based on the X-ray and radio intensity. The bright radio and X-ray filaments seem to be well correlated (middle panel). However, the radio shell is more symmetric and extends further towards the Galactic plane. There seems to be a correspondence between the continuum radio and sub-mm emission (yellow contour) tracing the cold dense region also noted by Maxted et al. (2015) in the CS MOPRA data. The right panel shows all three bands smoothed with a 0.06° Gaussian, corresponding to the PSF of the HESS data. We note region 15 at l ~ 353.5, b ~ −0.5 where the shell is only bright in TeV.
Current usage metrics show cumulative count of Article Views (full-text article views including HTML views, PDF and ePub downloads, according to the available data) and Abstracts Views on Vision4Press platform.
Data correspond to usage on the plateform after 2015. The current usage metrics is available 48-96 hours after online publication and is updated daily on week days.
Initial download of the metrics may take a while.