Fig. 6
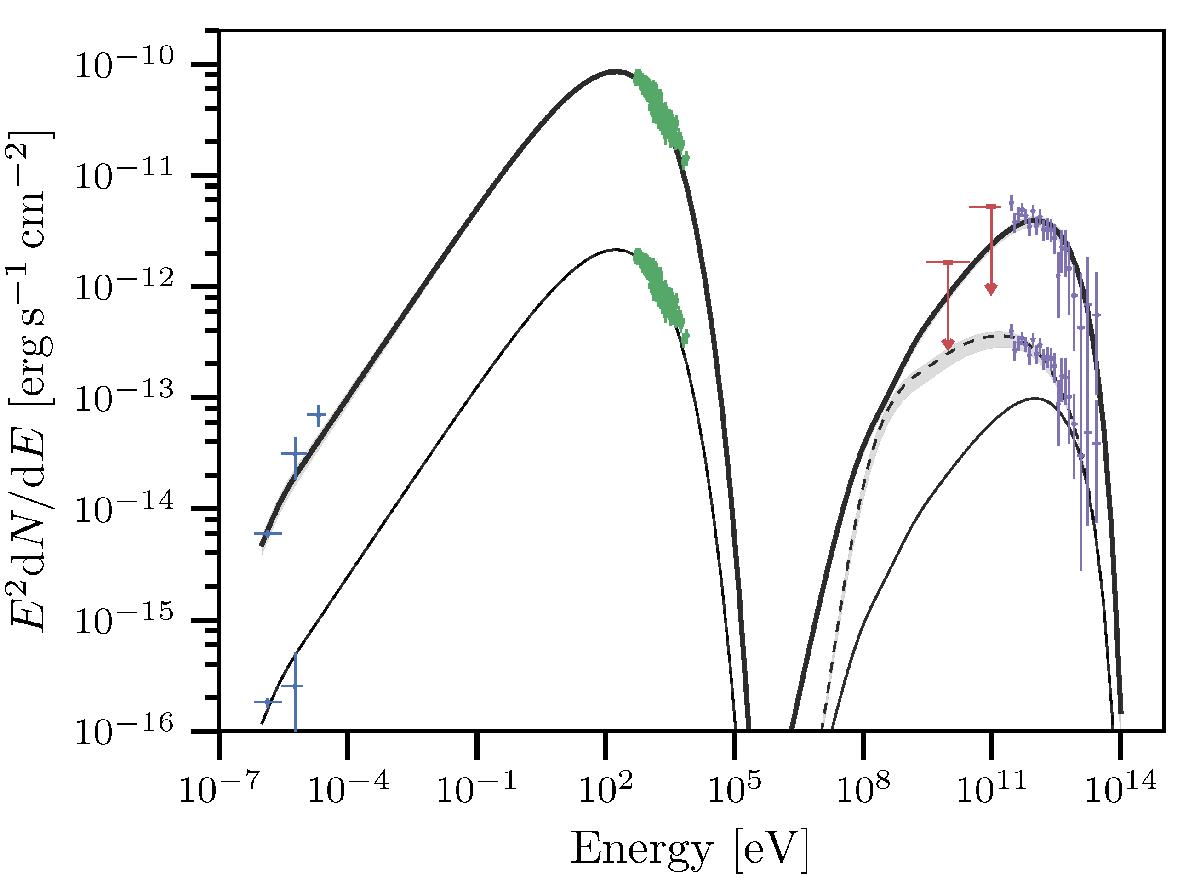
Broadband spectral energy distribution (SED) and the best-fit leptonic scenario model (upper set of lines). The X-ray spectrum used here is a simulated PN spectrum with an exposure adjusted to yield the same spectral index and flux uncertainties as the best-fit result presented in Table 2 (i.e. the flux is integrated over all extraction regions with the contribution of point sources removed). The lower set of lines shows the SED scaled to represent fluxes within region 19 and the corresponding leptonic model with all parameters fixed to that from a global fit. The same model with an additional hadronic component accounting for the excess TeV flux is also shown for illustration (dashed line).
Current usage metrics show cumulative count of Article Views (full-text article views including HTML views, PDF and ePub downloads, according to the available data) and Abstracts Views on Vision4Press platform.
Data correspond to usage on the plateform after 2015. The current usage metrics is available 48-96 hours after online publication and is updated daily on week days.
Initial download of the metrics may take a while.