Fig. 4
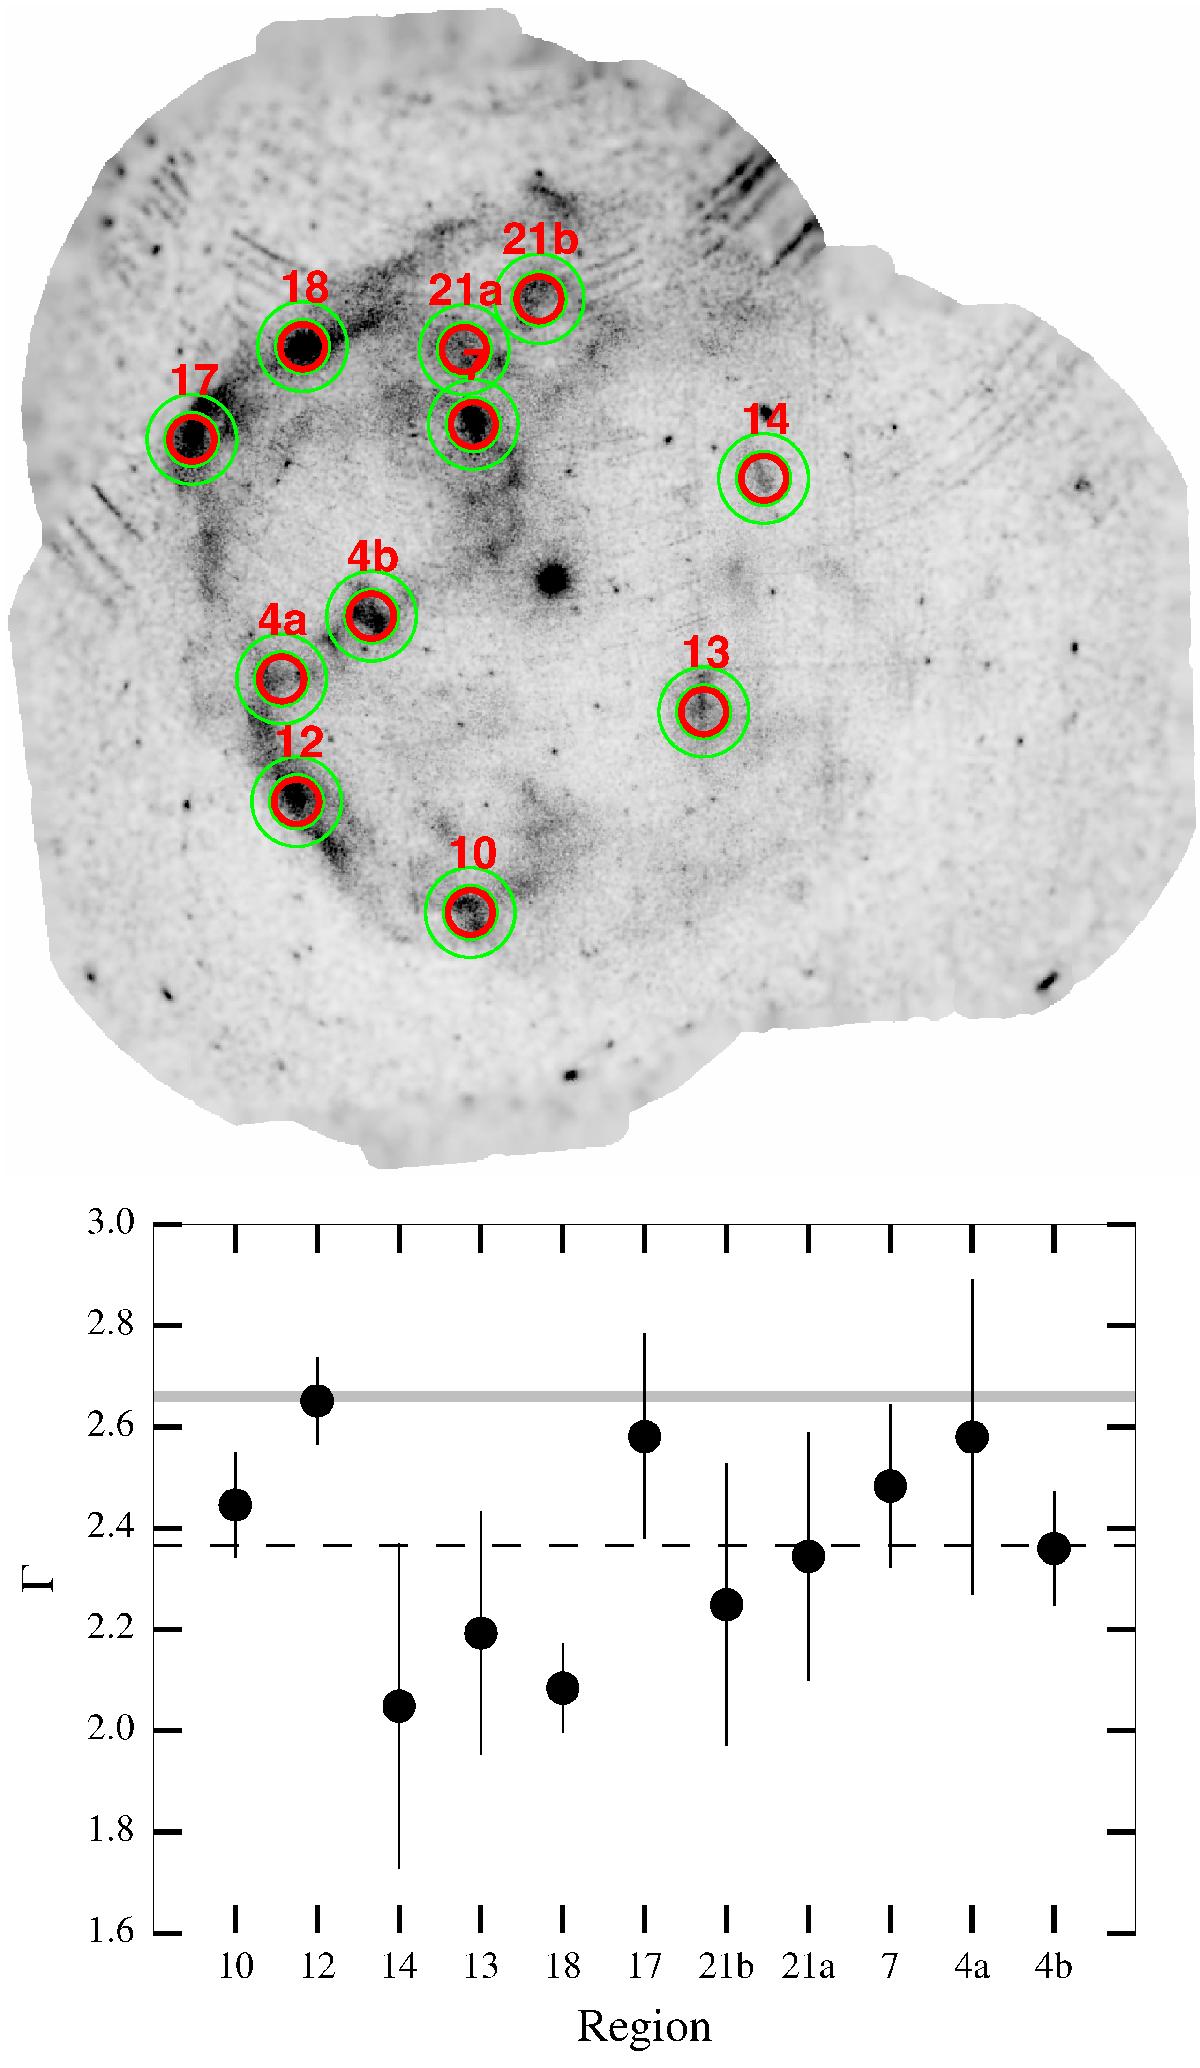
Definition of source and background regions used to probe variations of the photon index across the remnant (top, the image is in the 0.4–10 keV band, adaptively smoothed and corrected for exposure and quiescent particle background) and the best-fit values of the photon index for each region (bottom, 1σ uncertainties). The dashed line represents the mean value and the shaded area corresponds to the photon index estimated using entire shell. For consistency, the region names correspond to the larger regions introduced in Fig. 2.
Current usage metrics show cumulative count of Article Views (full-text article views including HTML views, PDF and ePub downloads, according to the available data) and Abstracts Views on Vision4Press platform.
Data correspond to usage on the plateform after 2015. The current usage metrics is available 48-96 hours after online publication and is updated daily on week days.
Initial download of the metrics may take a while.