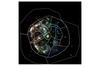
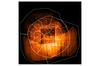
Fig. 2
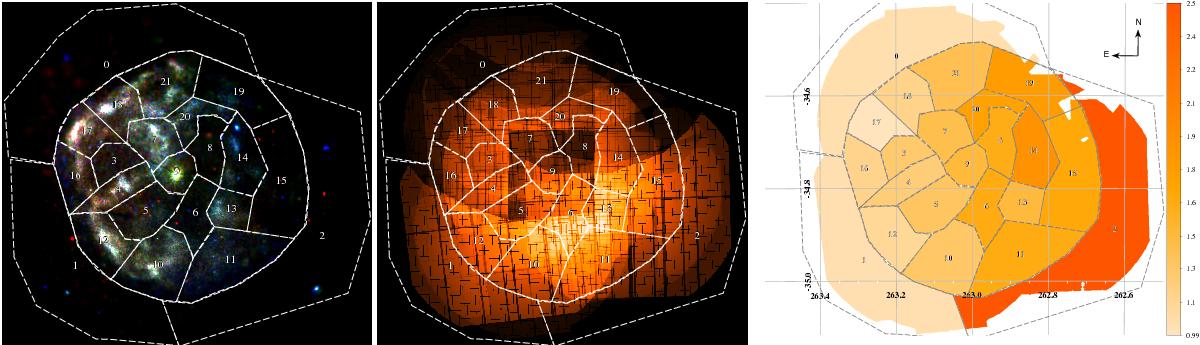
Left panel: mosaic pseudo-colour image in 0.4–1.8 keV (red), 1.8–2.8 keV (green), and 2.8–10 keV (blue) energy bands corrected for particle, soft proton, and residual stray-light contamination. The definition of regions used for spectral analysis is also shown. Middle panel: combined exposure map in 0.4–10 keV band where regions most heavily contaminated by stray light and excluded from the analysis can be identified. Right panel: colour-coded absorption column density.
Current usage metrics show cumulative count of Article Views (full-text article views including HTML views, PDF and ePub downloads, according to the available data) and Abstracts Views on Vision4Press platform.
Data correspond to usage on the plateform after 2015. The current usage metrics is available 48-96 hours after online publication and is updated daily on week days.
Initial download of the metrics may take a while.