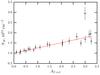
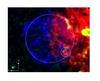
Fig. 11
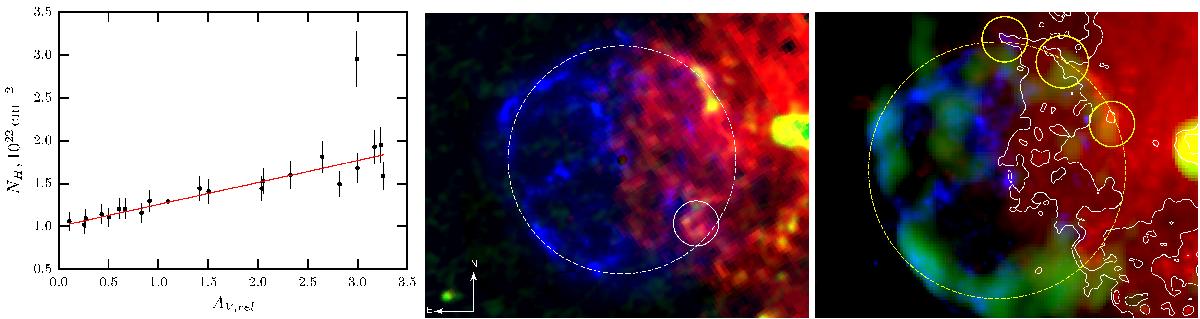
Correlation of the absorption column measured from the spatially resolved spectral analysis of XMM-Newton data and the relative reddening derived from VVV photometry (left panel). The outlier point corresponds to region 2 where the optical extinction is underestimated due to the lack of stars in the optical data. We find NH ~ 1 + AV,rel/ 4 from a linear fit including a 10% systematic uncertainty for the column measured in X-rays. A composite image of the calibrated absorption column density map derived from optical extinction (red) and ATLASGAL 0.87 mm (green) maps is shown together with the X-ray 0.4–10 keV image (blue) for reference in the middle panel. We note the enhanced absorption along the western rim of the remnant, particularly along its north-western part. The same features can be traced in the composite image showing X-ray (blue), radio (green), and 350 μm Herschel/SPIRE data (right panel). The white contours correspond to Herschel data to highlight the extension of the filament in the north-west in northern direction where it bridges with the X-ray filament as shown with the northernmost yellow circle (see also the middle panel where the X-ray filament is more clearly seen). The other two circles emphasise the correspondence between the infrared and radio data along the filament.
Current usage metrics show cumulative count of Article Views (full-text article views including HTML views, PDF and ePub downloads, according to the available data) and Abstracts Views on Vision4Press platform.
Data correspond to usage on the plateform after 2015. The current usage metrics is available 48-96 hours after online publication and is updated daily on week days.
Initial download of the metrics may take a while.