Free Access
Fig. 8
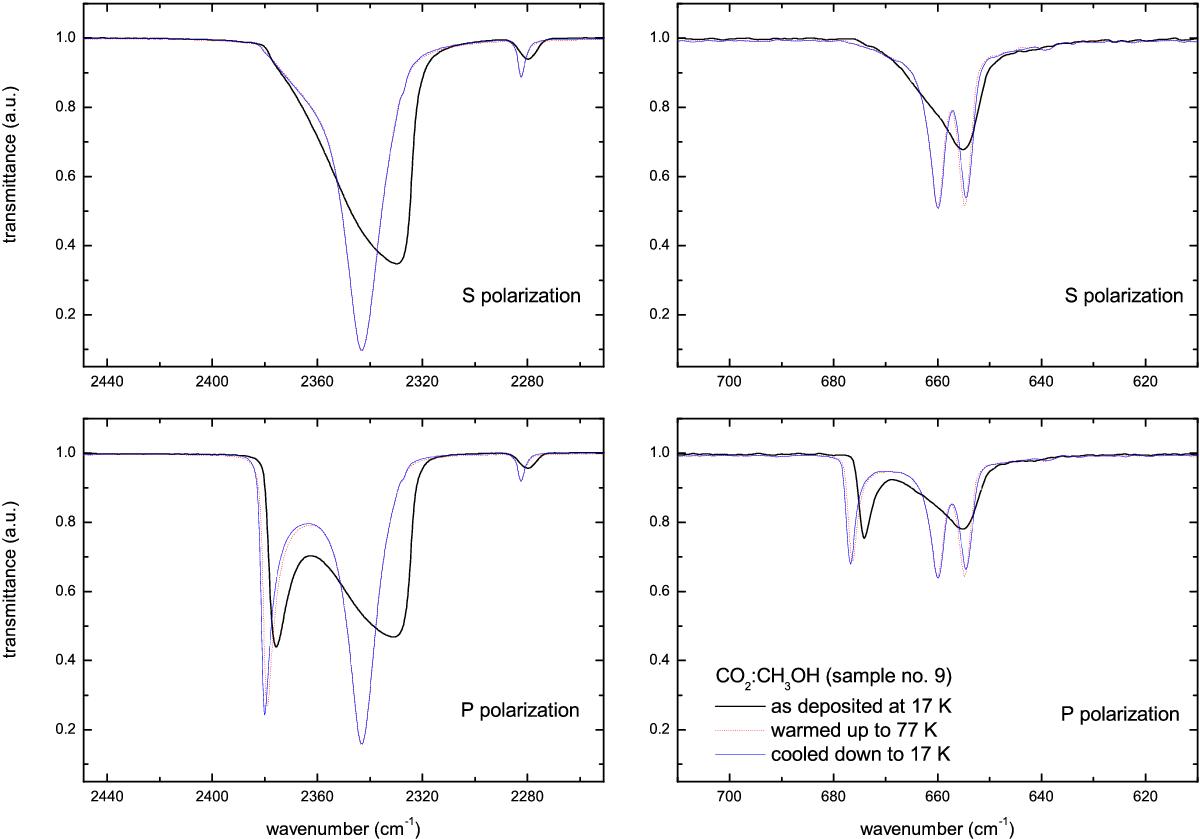
Transmittance spectra of sample No. 9 (CO2:CH3OH = 11:1 mixture) in the 2450–2250 cm-1 spectral region (left-hand panels) and in the 710–610 cm-1 spectral region (right-hand panels). Spectra are acquired after sample deposition at 17 K, after thermal annealing to 77 K and after cooling down to 17 K.
Current usage metrics show cumulative count of Article Views (full-text article views including HTML views, PDF and ePub downloads, according to the available data) and Abstracts Views on Vision4Press platform.
Data correspond to usage on the plateform after 2015. The current usage metrics is available 48-96 hours after online publication and is updated daily on week days.
Initial download of the metrics may take a while.