Fig. 7
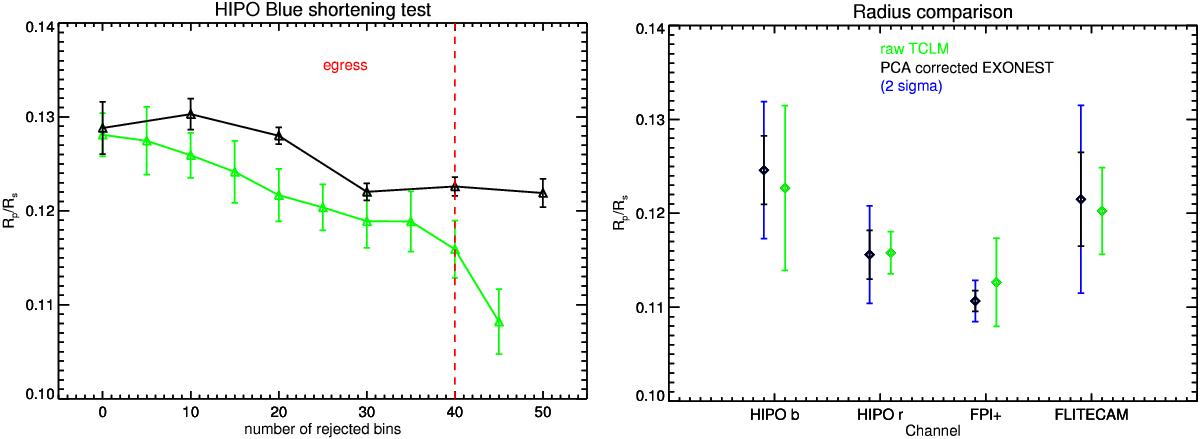
Left: estimates of the planet-to-star radius ratio for the the HIPO blue observations; from left to right, more data points were neglected from the post-transit observations in steps of 5/10 points. The vertical red line indicates the end of egress, that is, neglecting more points would neglect in-transit data. This indicates that the upward post-transit trend seen in Fig. 4 has affected the measured transit depth. Right: comparison of the results obtained with our two different fitting approaches.
Current usage metrics show cumulative count of Article Views (full-text article views including HTML views, PDF and ePub downloads, according to the available data) and Abstracts Views on Vision4Press platform.
Data correspond to usage on the plateform after 2015. The current usage metrics is available 48-96 hours after online publication and is updated daily on week days.
Initial download of the metrics may take a while.