Fig. 6
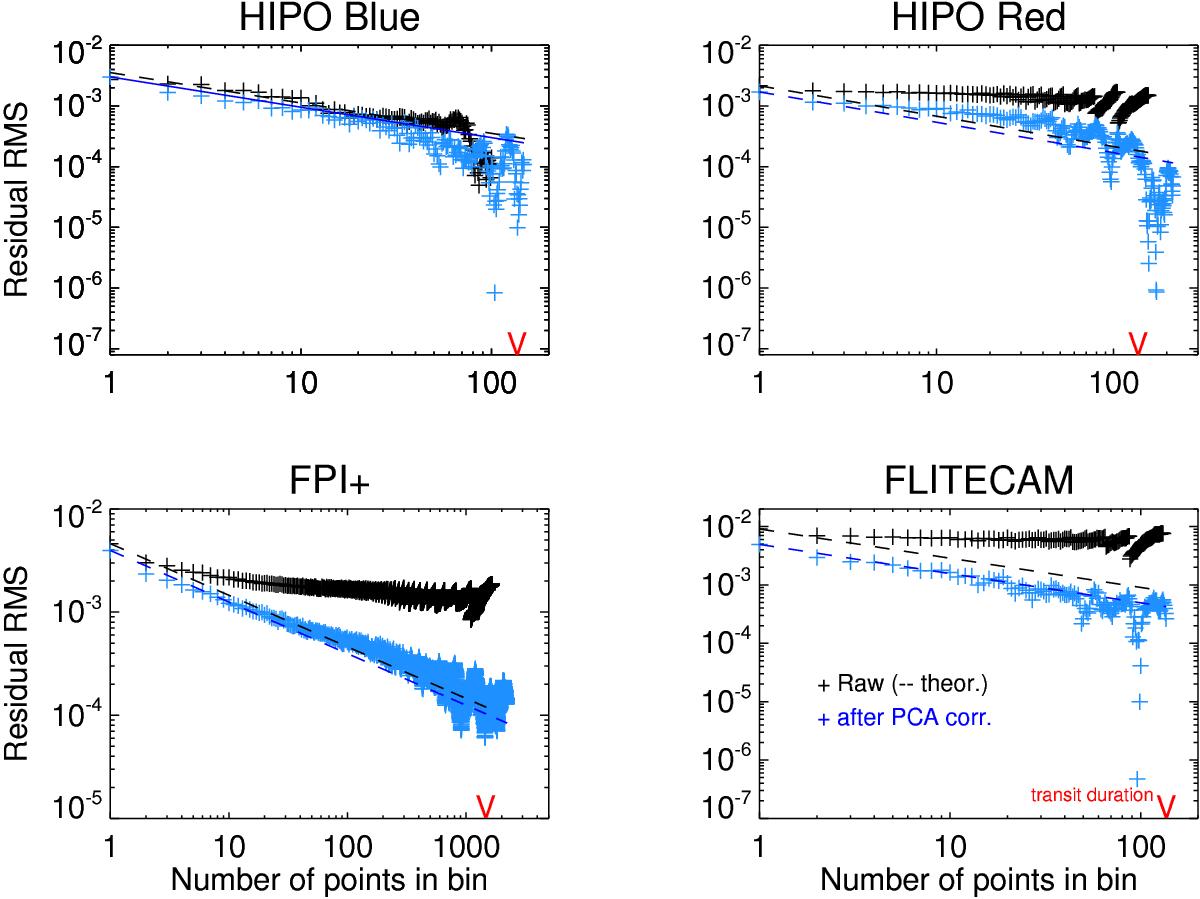
Residual rms versus bin size for each channel. The black marks represent the values for the raw light curves, whereas the blue corresponds to the de-trended light curves after the best-fit principal component model was subtracted. Dashed lines represent the theoretical values for pure white noise, red arrows mark the transit duration as reference.
Current usage metrics show cumulative count of Article Views (full-text article views including HTML views, PDF and ePub downloads, according to the available data) and Abstracts Views on Vision4Press platform.
Data correspond to usage on the plateform after 2015. The current usage metrics is available 48-96 hours after online publication and is updated daily on week days.
Initial download of the metrics may take a while.