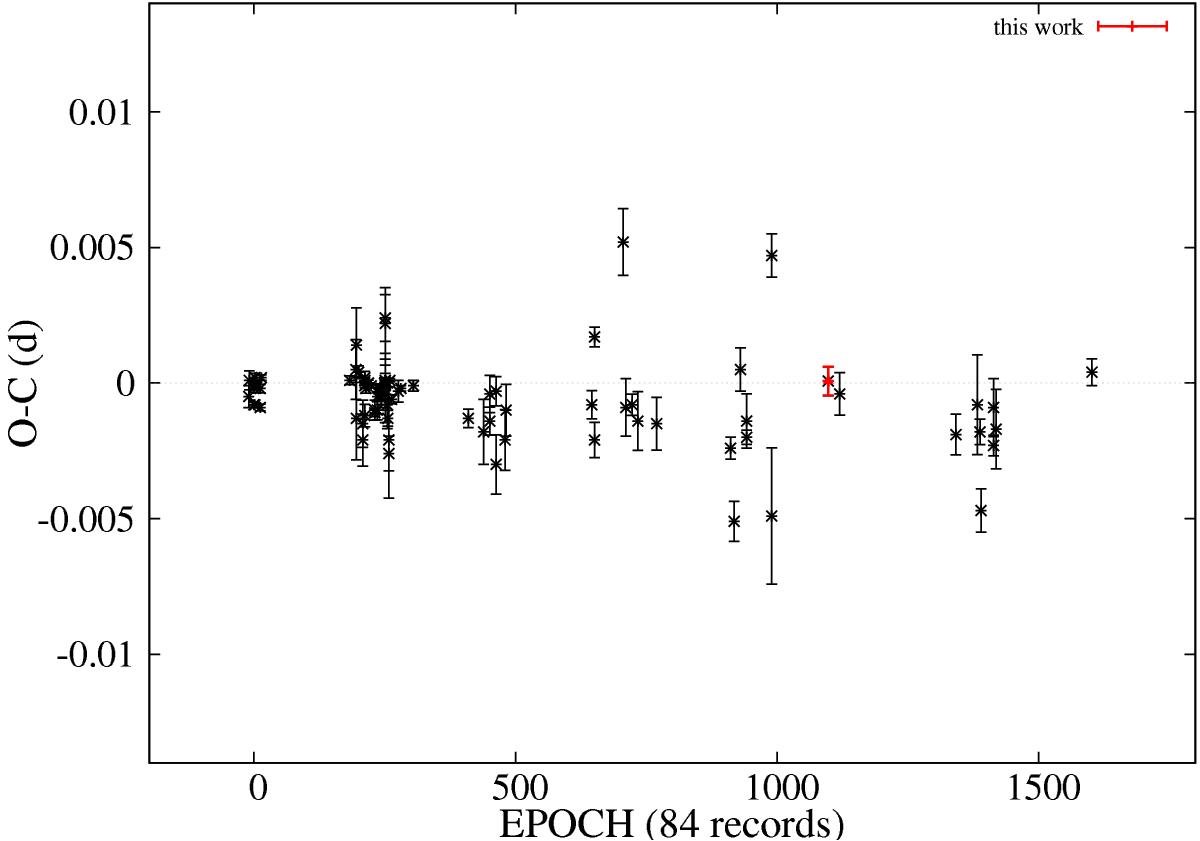
Fig. 3

O−C diagram of GJ 1214b. The red point marks our measurement. Black points are taken from Poddaný et al. (2010) using all (professional and citizen science) data from the Exoplanet Transit Database. For example the point at O−C = 0.005 comes from one of the TRESCA light curves. Our data is consistent with other measurements finding no significant long-term variations in transit timing.
Current usage metrics show cumulative count of Article Views (full-text article views including HTML views, PDF and ePub downloads, according to the available data) and Abstracts Views on Vision4Press platform.
Data correspond to usage on the plateform after 2015. The current usage metrics is available 48-96 hours after online publication and is updated daily on week days.
Initial download of the metrics may take a while.


