Free Access
Fig. 14
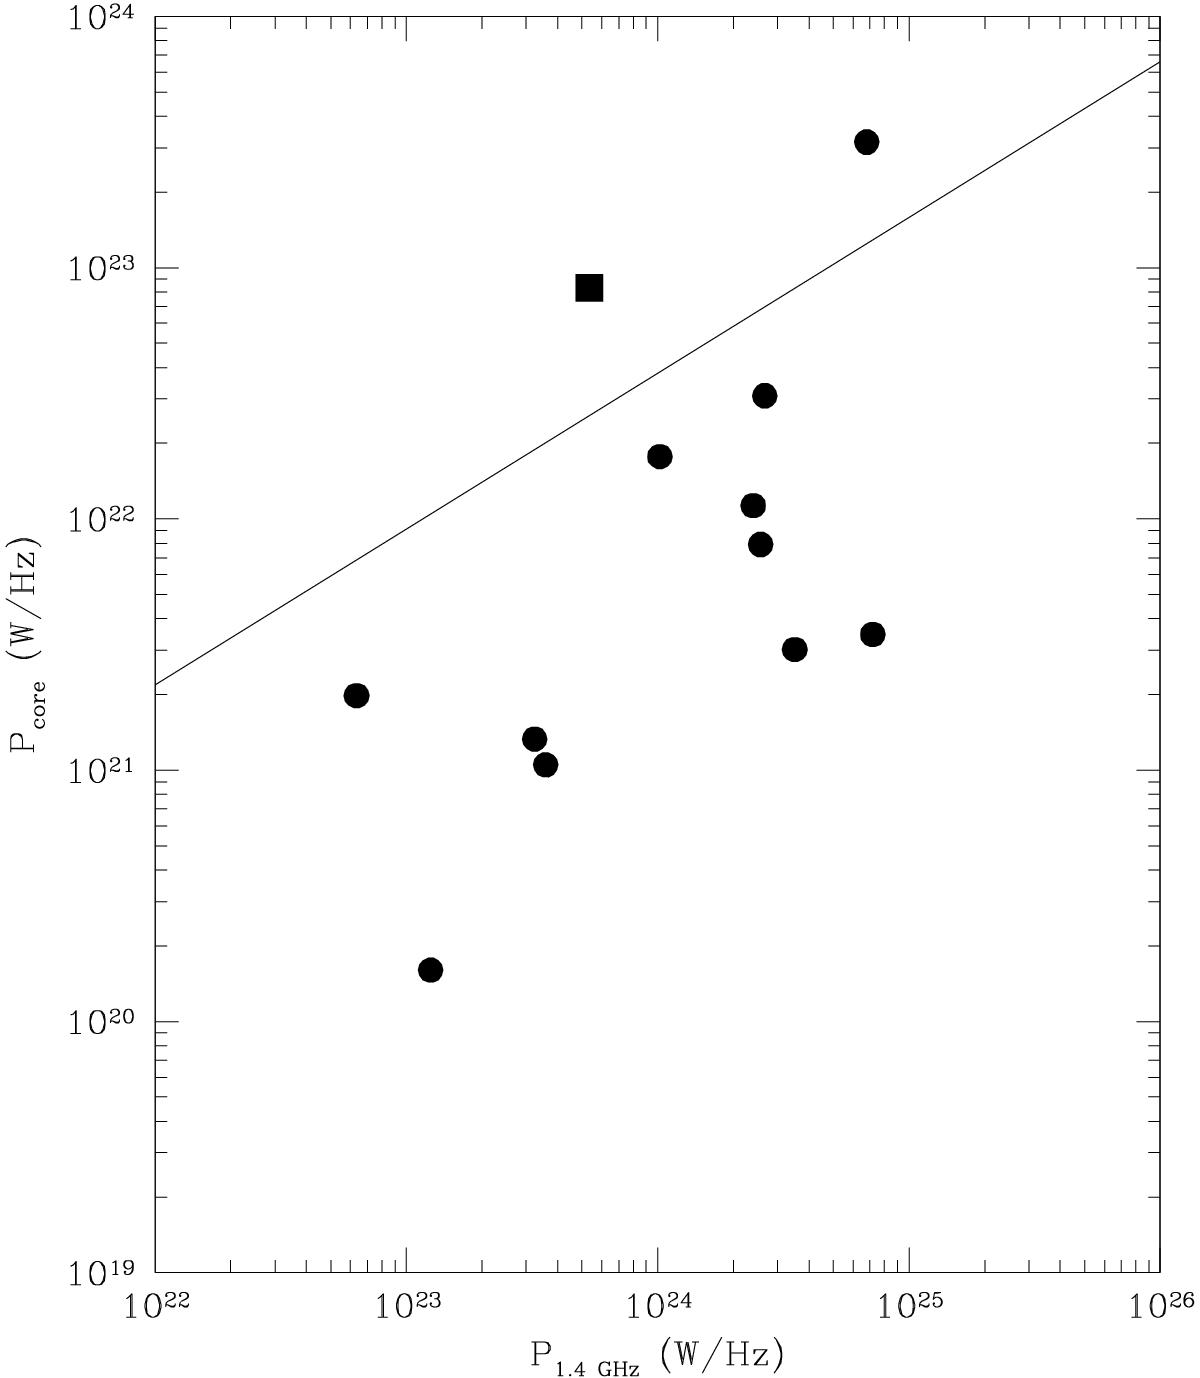
Core power obtained from data at 15 GHz versus the total power at 1.4 GHz for the radio galaxies observed here and for IC 310 (square). Errors on powers are not indicated because they are as small as the symbols. The continuous line reports the correlation from the literature (see text).
Current usage metrics show cumulative count of Article Views (full-text article views including HTML views, PDF and ePub downloads, according to the available data) and Abstracts Views on Vision4Press platform.
Data correspond to usage on the plateform after 2015. The current usage metrics is available 48-96 hours after online publication and is updated daily on week days.
Initial download of the metrics may take a while.