Fig. 5
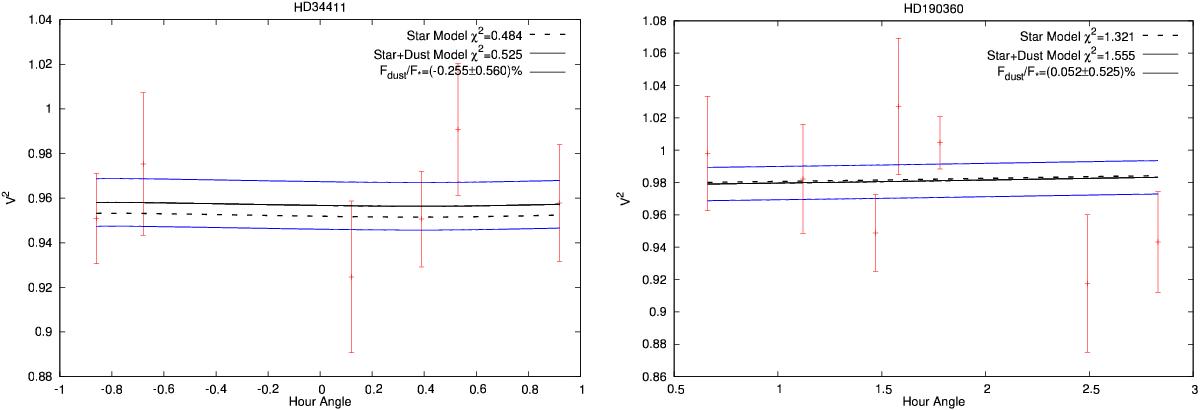
Squared visibility as a function of hour angle for the E1-E2 (65 m) baseline. The dashed curve represents the stellar photosphere model, with a model uncertainty of < 0.1% (not shown). The solid black curve represents the best fit squared visibility model using excess emission that uniformly fills the field of view. Both objects are consistent with a non-excess and compatible with the stellar photosphere model as indicated by the low reduced ![]() values of the star only model.
values of the star only model.
Current usage metrics show cumulative count of Article Views (full-text article views including HTML views, PDF and ePub downloads, according to the available data) and Abstracts Views on Vision4Press platform.
Data correspond to usage on the plateform after 2015. The current usage metrics is available 48-96 hours after online publication and is updated daily on week days.
Initial download of the metrics may take a while.