Fig. 4
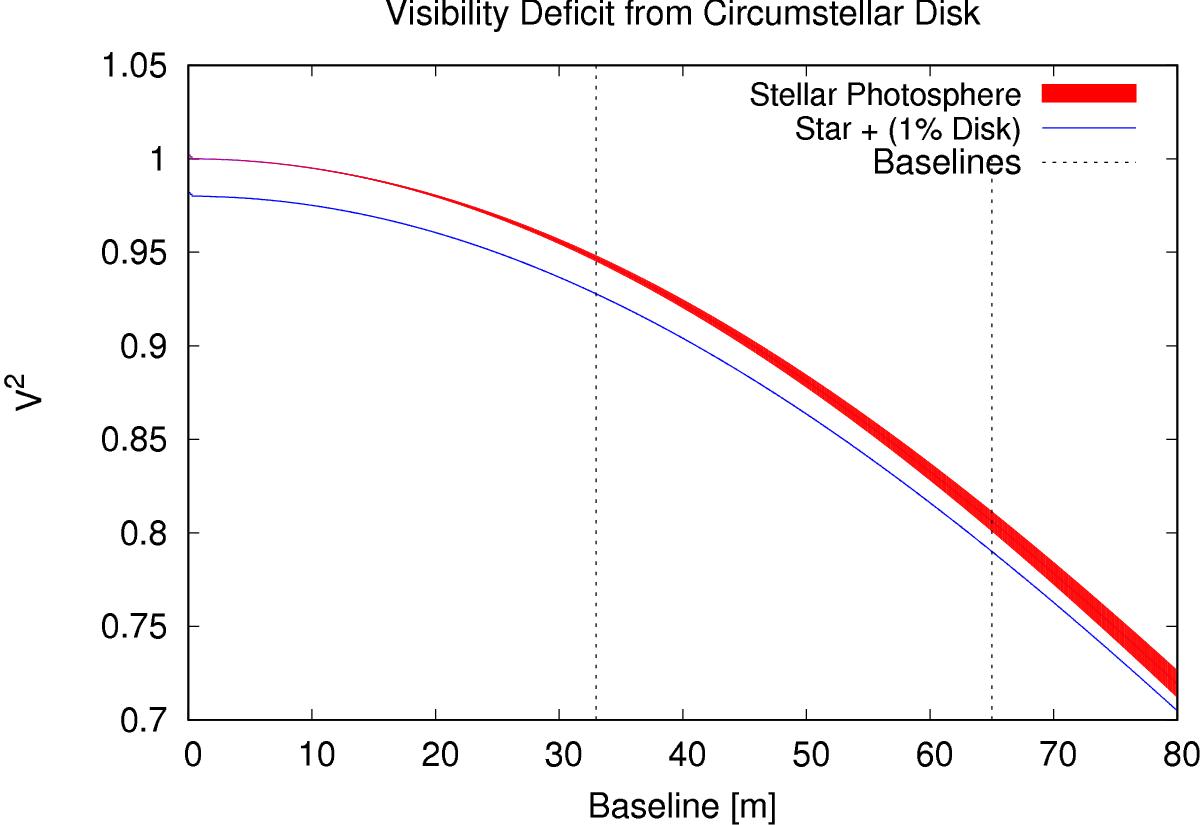
Filled red curve represents the predicted squared visibility for a uniform-disk type star, with a diameter of (1 ± 0.05) mas. The blue line represents the squared visibility of the star with a circumstellar disk of 1% brightness relative to the star, that uniformily fills the entire field of view. We note that at short baselines, the uncertainty of the stellar model, i.e., the width of the red curve, is much smaller than the visibility deficit that results from fully resolving the faint circumstellar disk. The squared visibility is equal to one at zero baseline for both models. Also shown are the 33 m and 65 m baselines used for this study.
Current usage metrics show cumulative count of Article Views (full-text article views including HTML views, PDF and ePub downloads, according to the available data) and Abstracts Views on Vision4Press platform.
Data correspond to usage on the plateform after 2015. The current usage metrics is available 48-96 hours after online publication and is updated daily on week days.
Initial download of the metrics may take a while.