Fig. 20
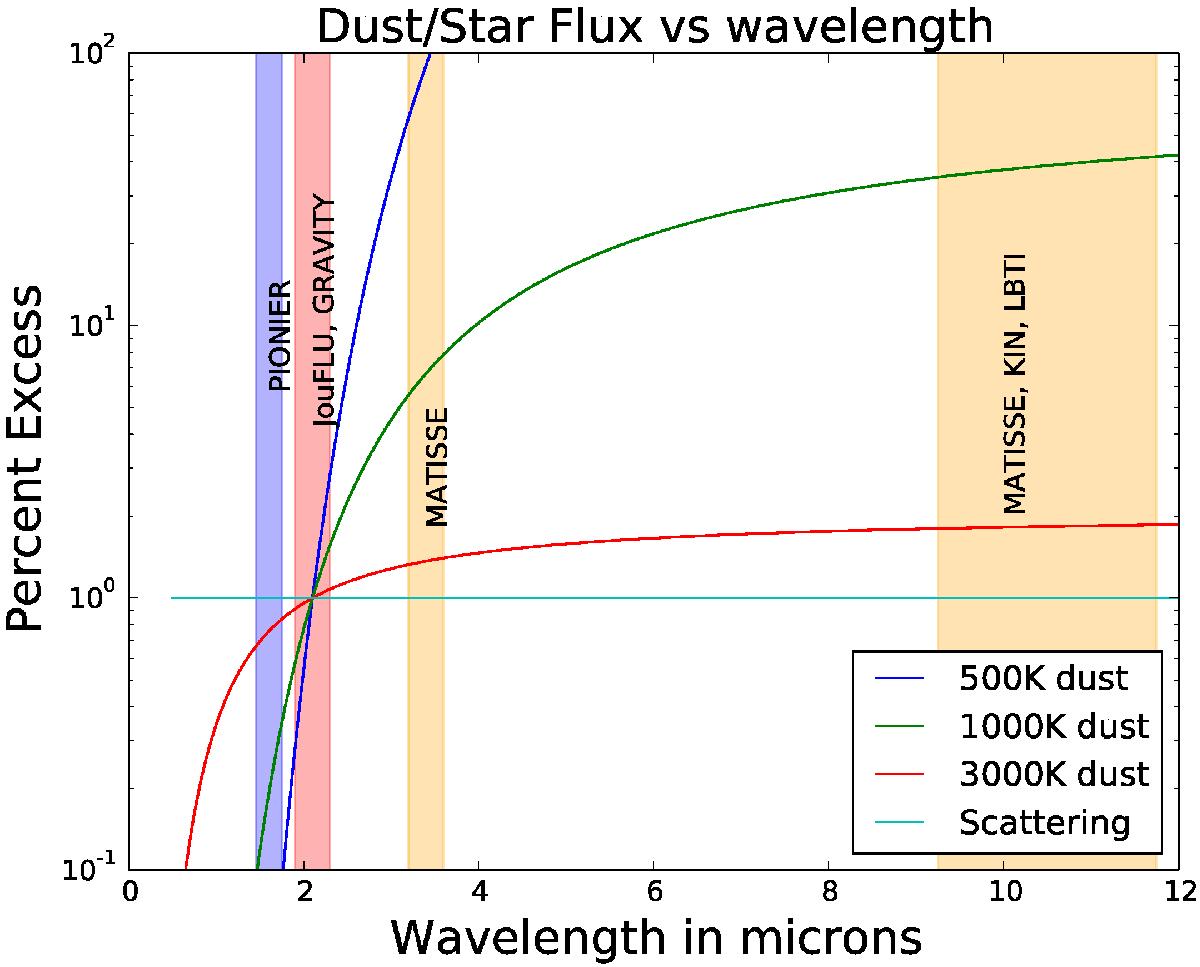
Assuming thermally emitting dust, with a K-band flux ratio of 1% relative to a star of 6000 K, the curves show the expected contrast as a function of wavelength, and each curve corresponds to a different dust temperature. The shaded regions correspond to the accessible spectral bands for different interferometers, including second-generation instruments such as GRAVITY (Straubmeier et al. 2014) and MATISSE (Matter et al. 2016).
Current usage metrics show cumulative count of Article Views (full-text article views including HTML views, PDF and ePub downloads, according to the available data) and Abstracts Views on Vision4Press platform.
Data correspond to usage on the plateform after 2015. The current usage metrics is available 48-96 hours after online publication and is updated daily on week days.
Initial download of the metrics may take a while.