Free Access
Fig. 17
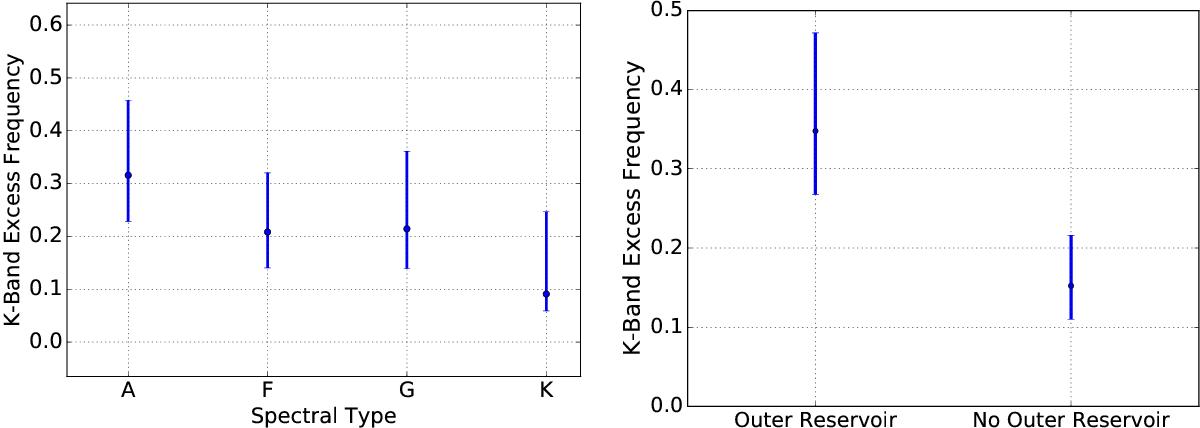
Excess rates of Table 5. Left panel: excess rate for different spectral types. Right panel: excess rate with or without a detected cold-dust reservoir. The error-bars are asymmetric, are and computed by numerically integrating the binomial distribution.
This figure is made of several images, please see below:
Current usage metrics show cumulative count of Article Views (full-text article views including HTML views, PDF and ePub downloads, according to the available data) and Abstracts Views on Vision4Press platform.
Data correspond to usage on the plateform after 2015. The current usage metrics is available 48-96 hours after online publication and is updated daily on week days.
Initial download of the metrics may take a while.